Platforms
RiverReports allows you to embed charts on your own site for free.
Embeding RiverReports charts works the same as sites like Twitter,
Instagram, and YouTube–it's quick and easy to implement but also easy
to update. Charts can also be customized to suit your needs–whether
that means displaying a slightly different location name, showing more
data, or using your brand's colors. Charts are also optimized to look
great on both desktop and mobile devices.
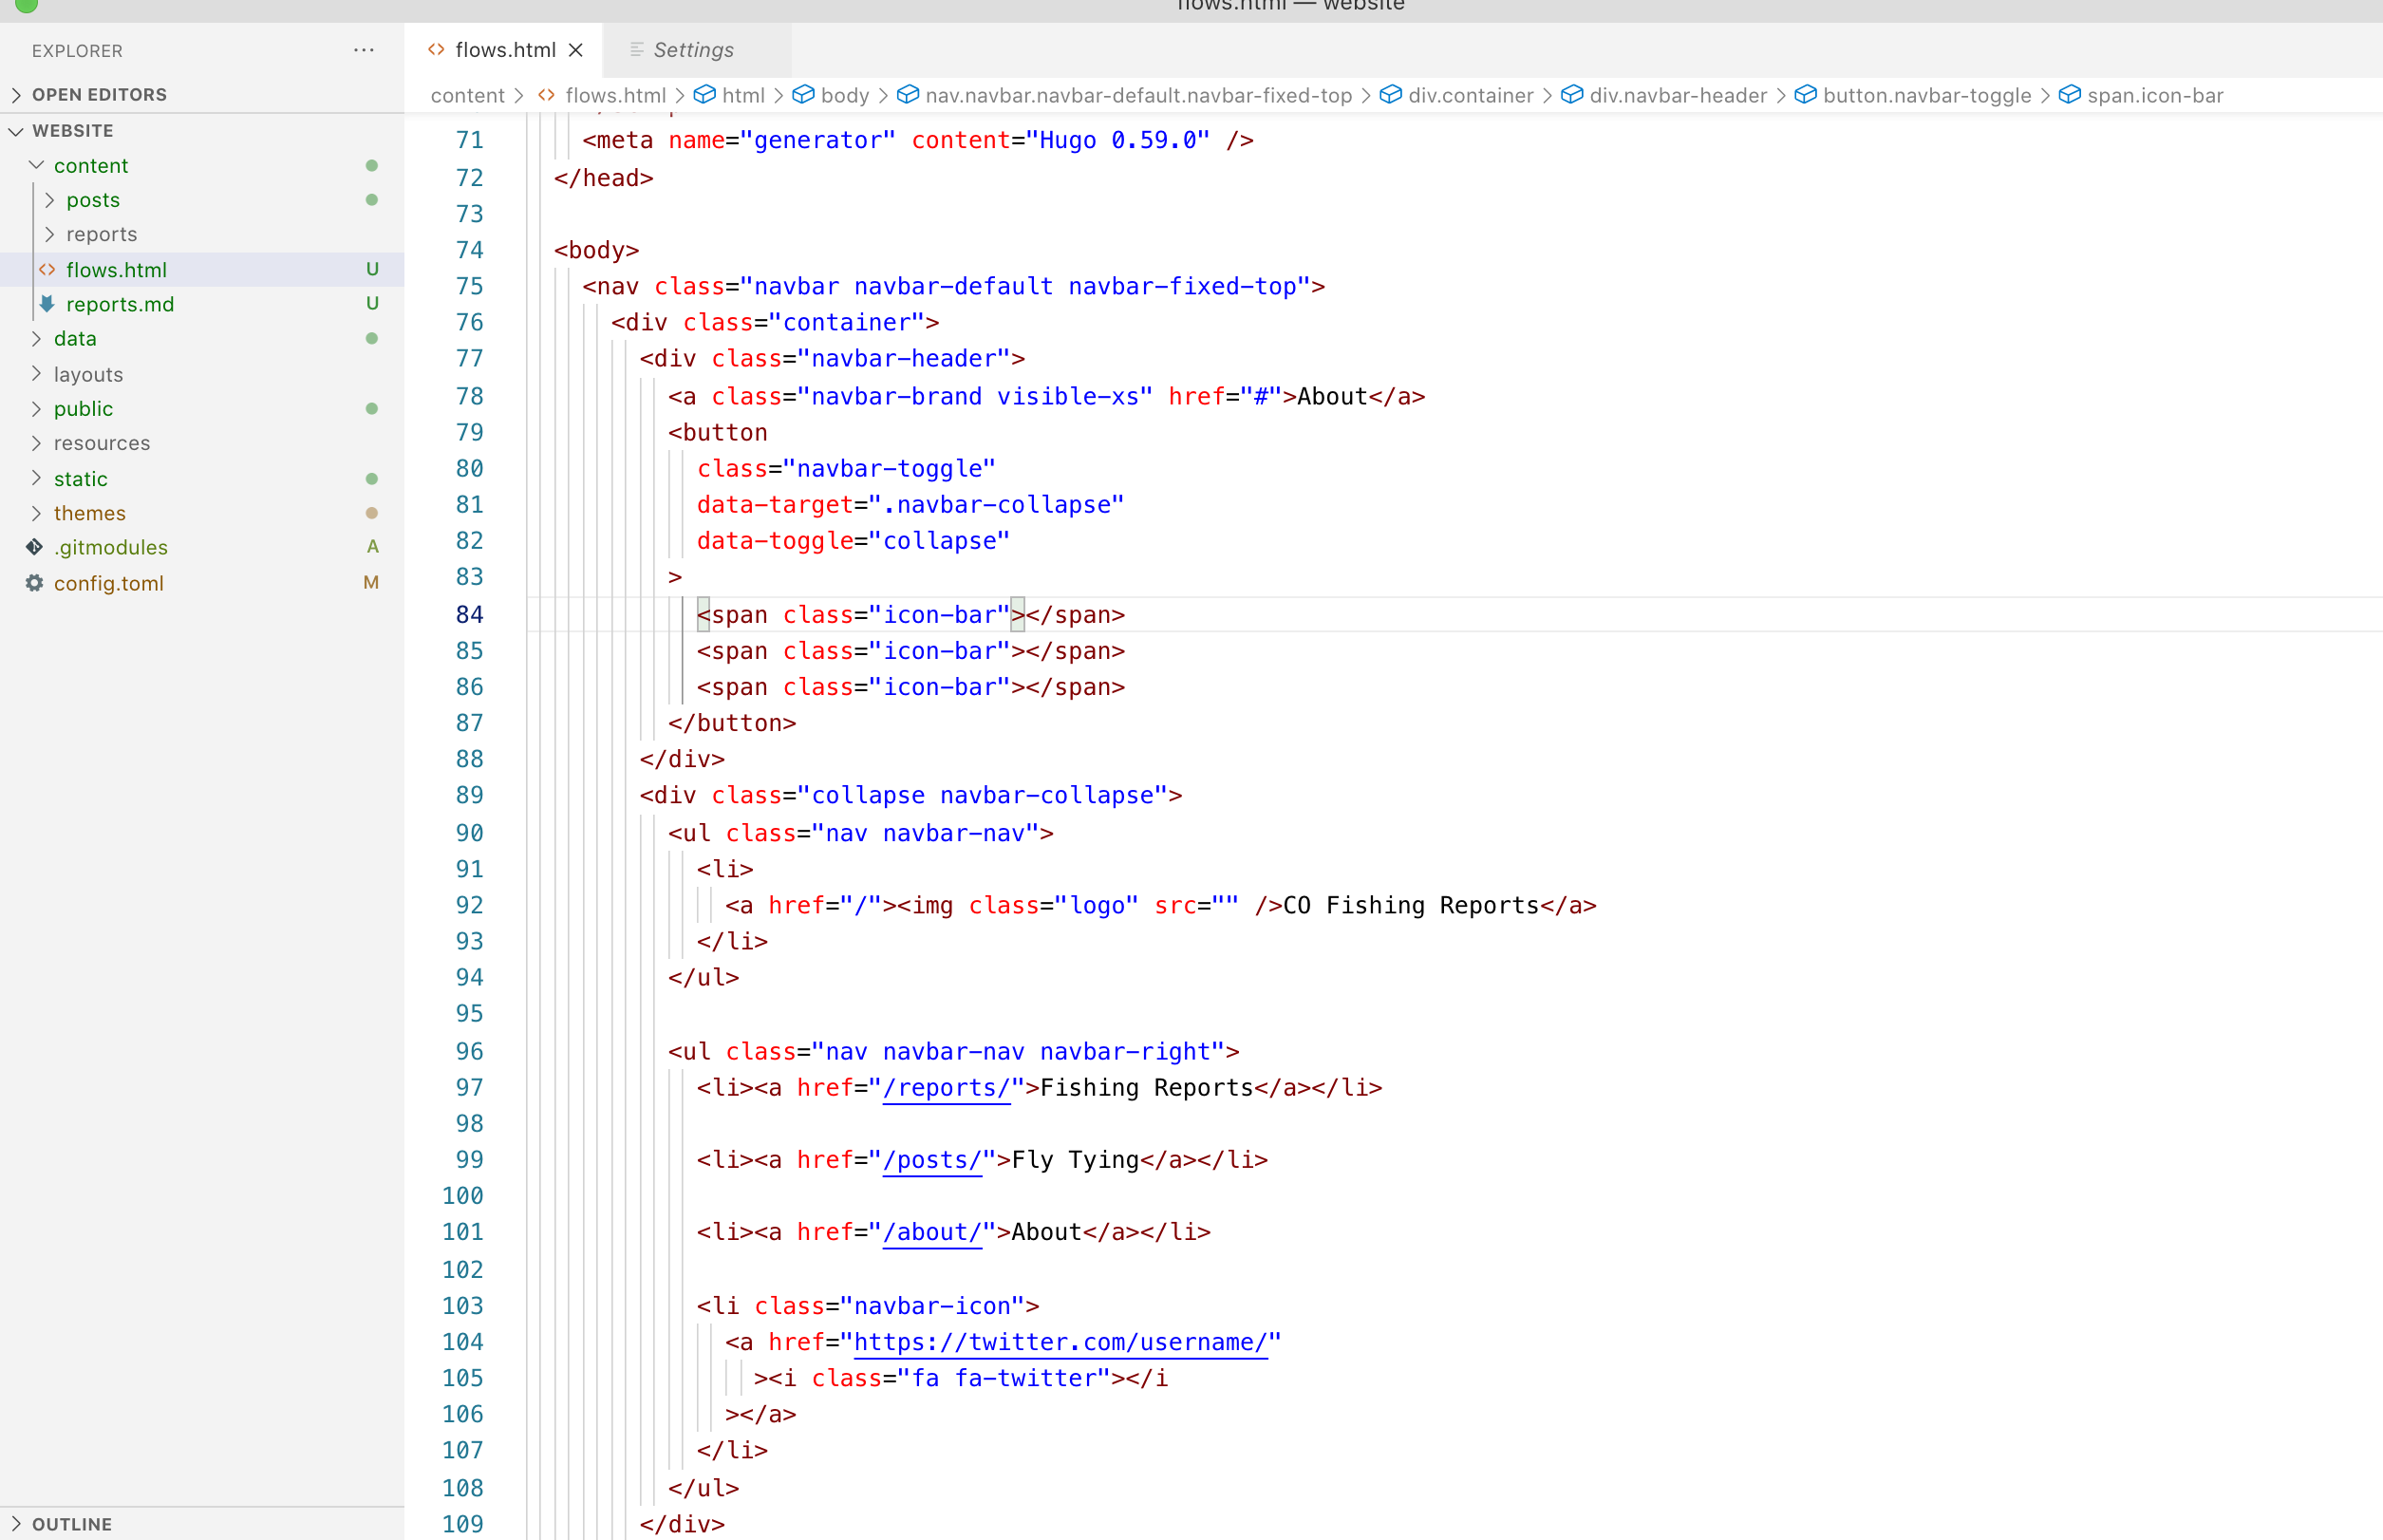
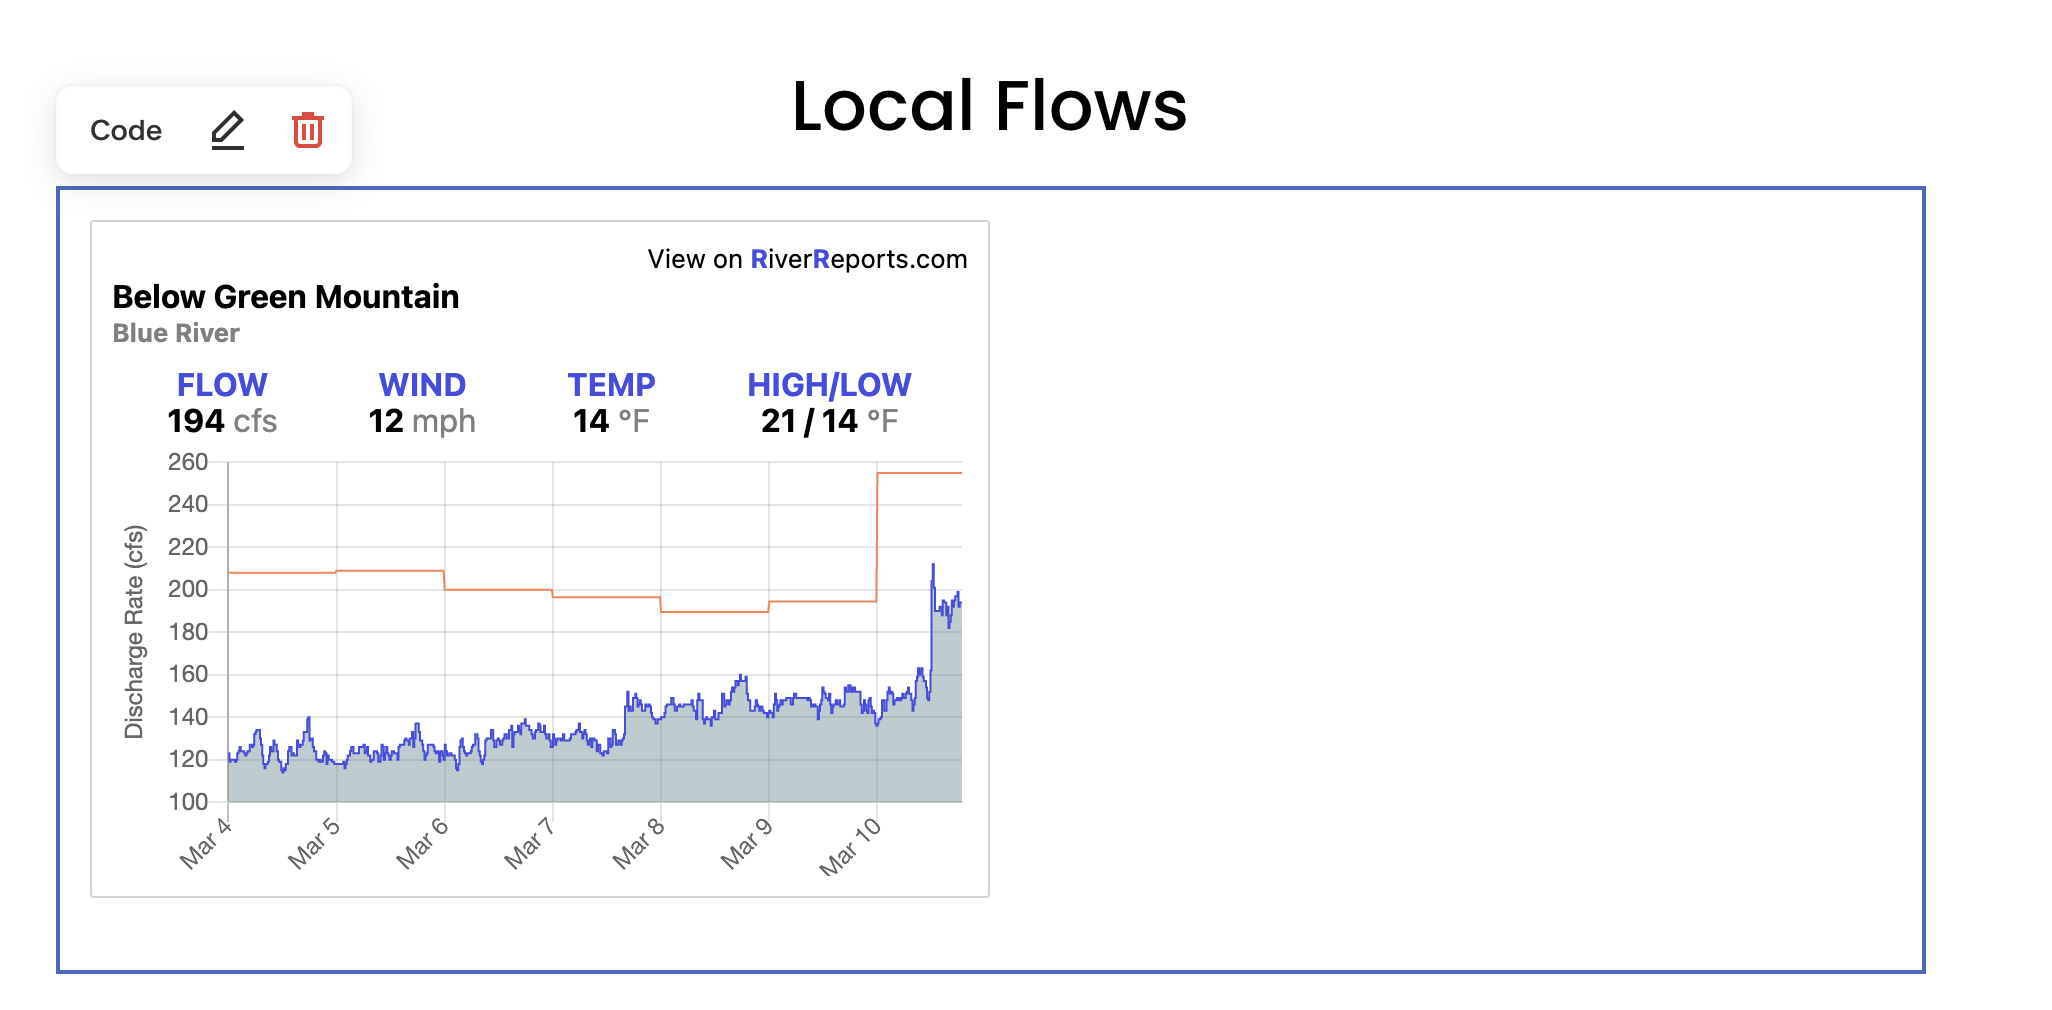
RiverReports charts are embedded using an iframe HTML tag. As mentioned, this is the same way that popular site such as YouTube work. So if you've ever put a YouTube video on your site, you
also know how to embed a RiverReports chart!
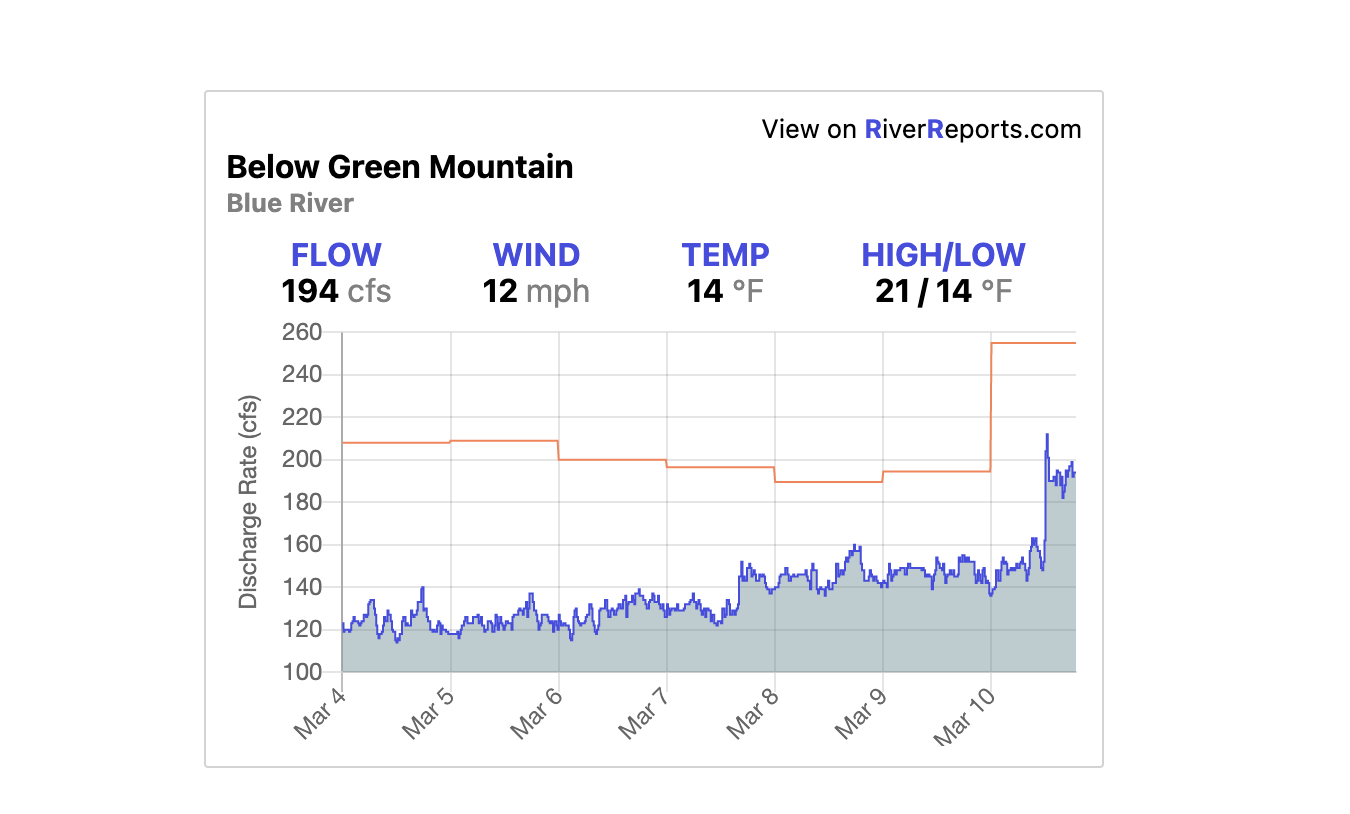
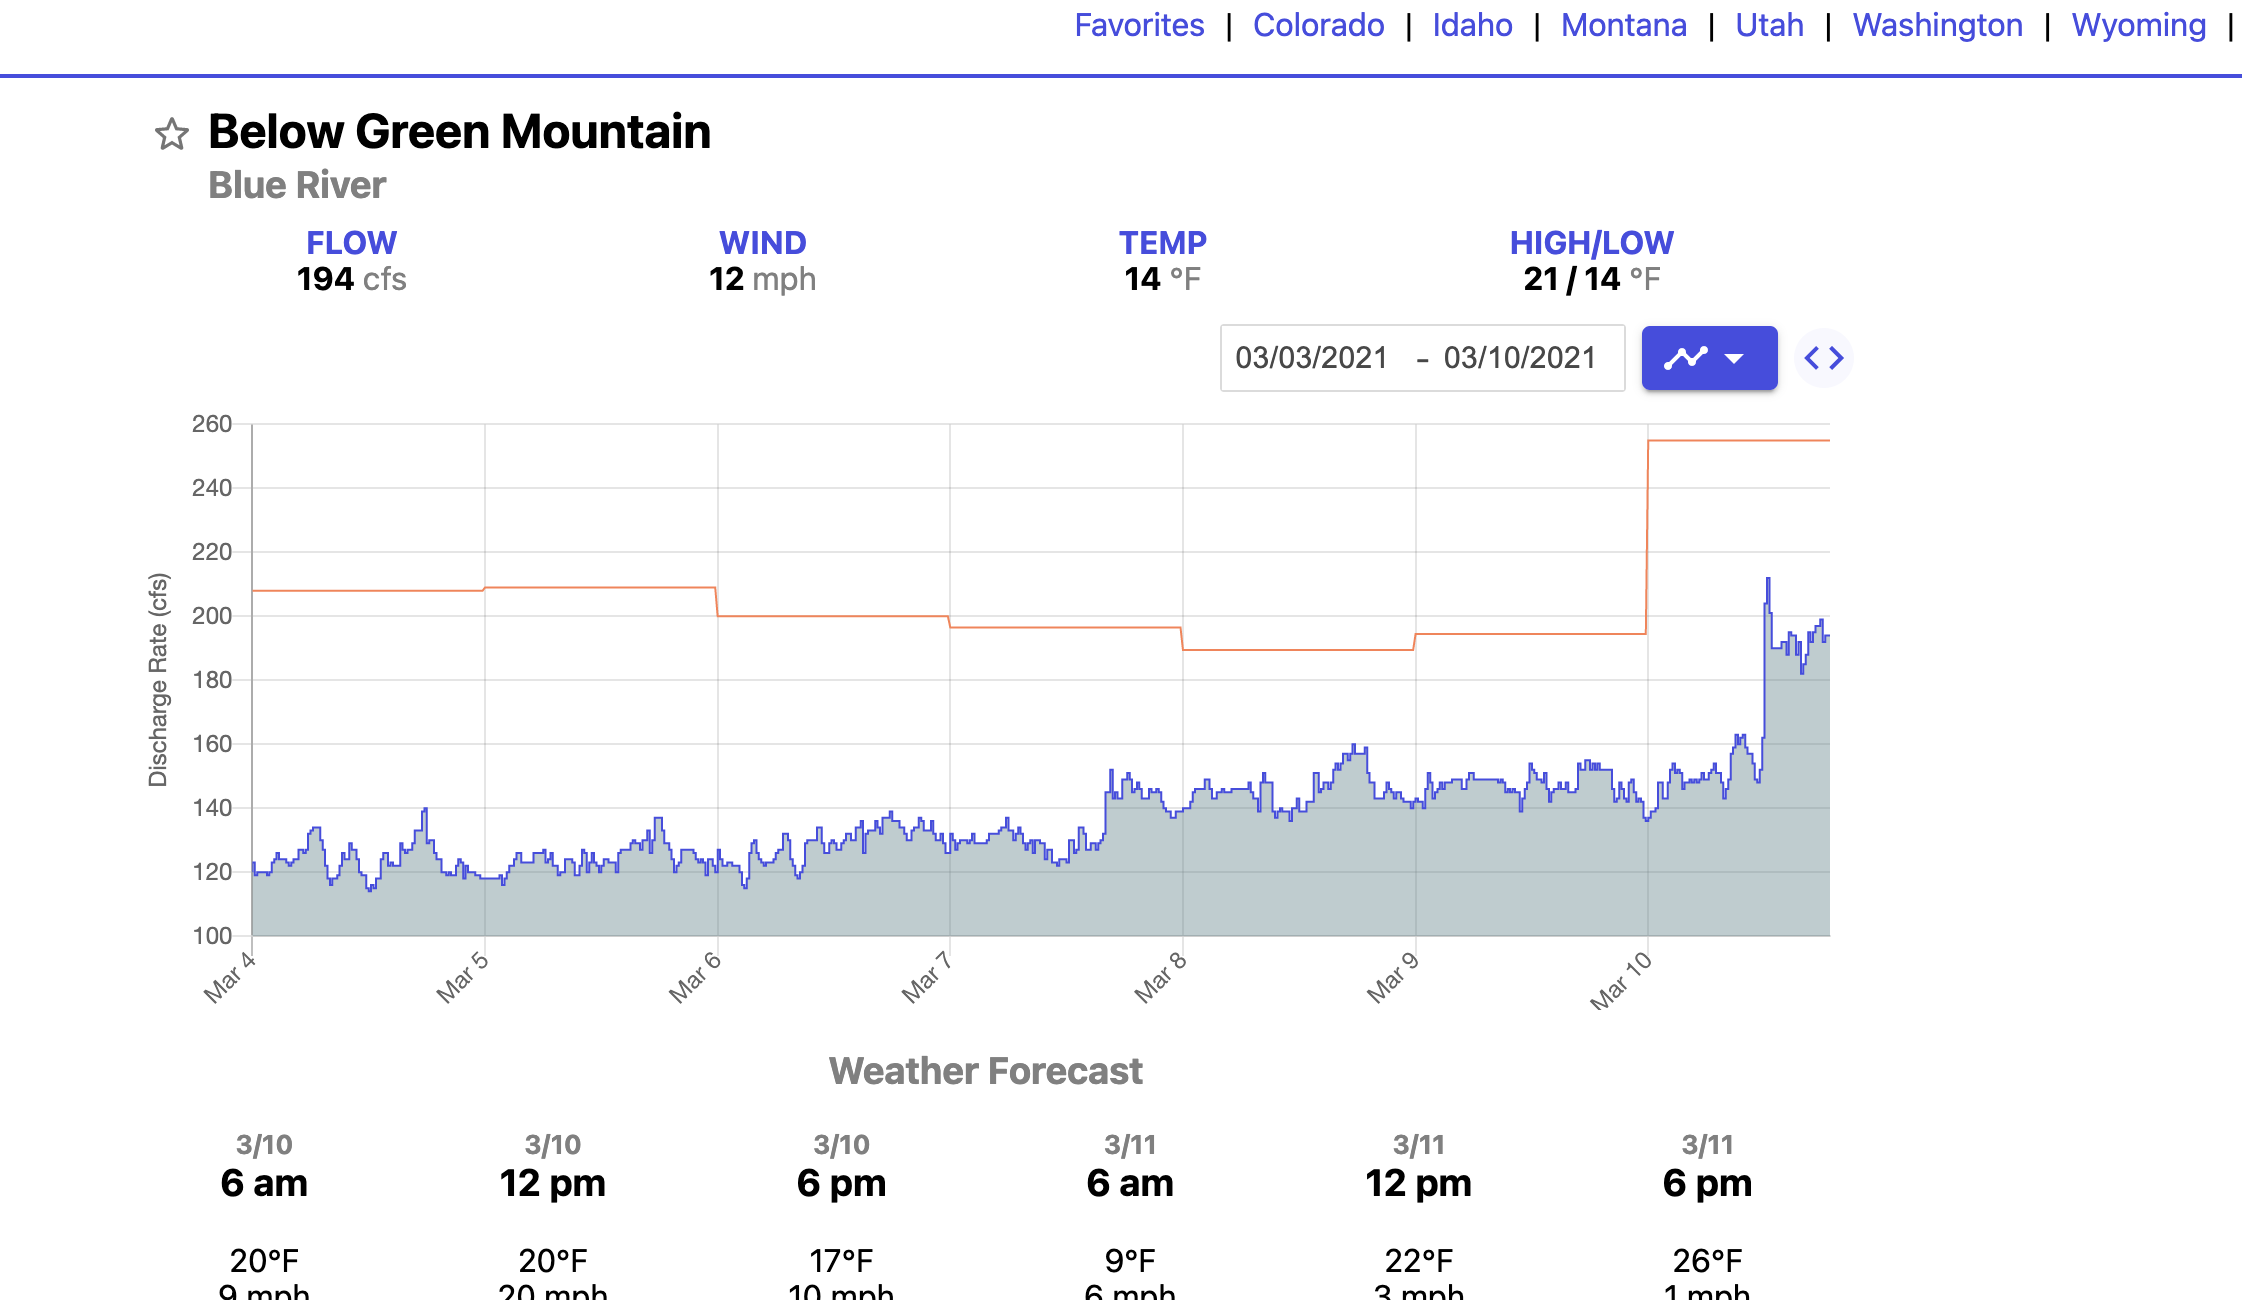
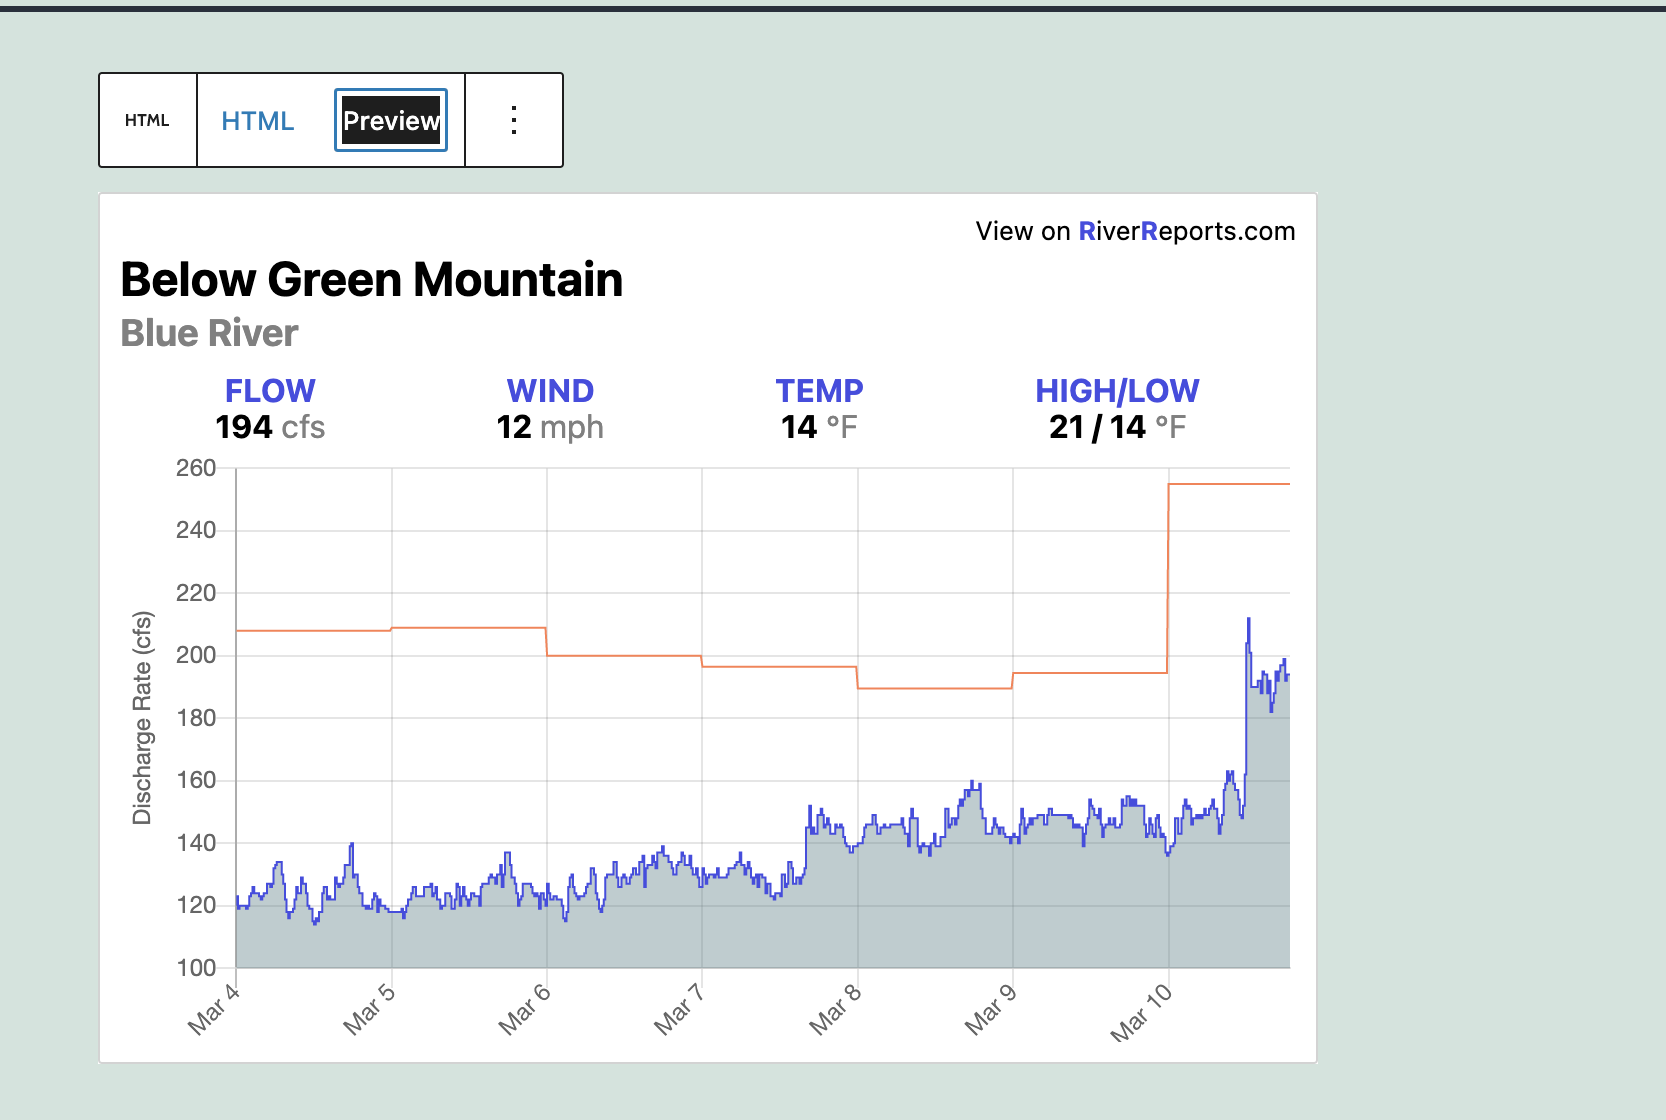
Above is a live example of an embedded chart using HTML.
HTML
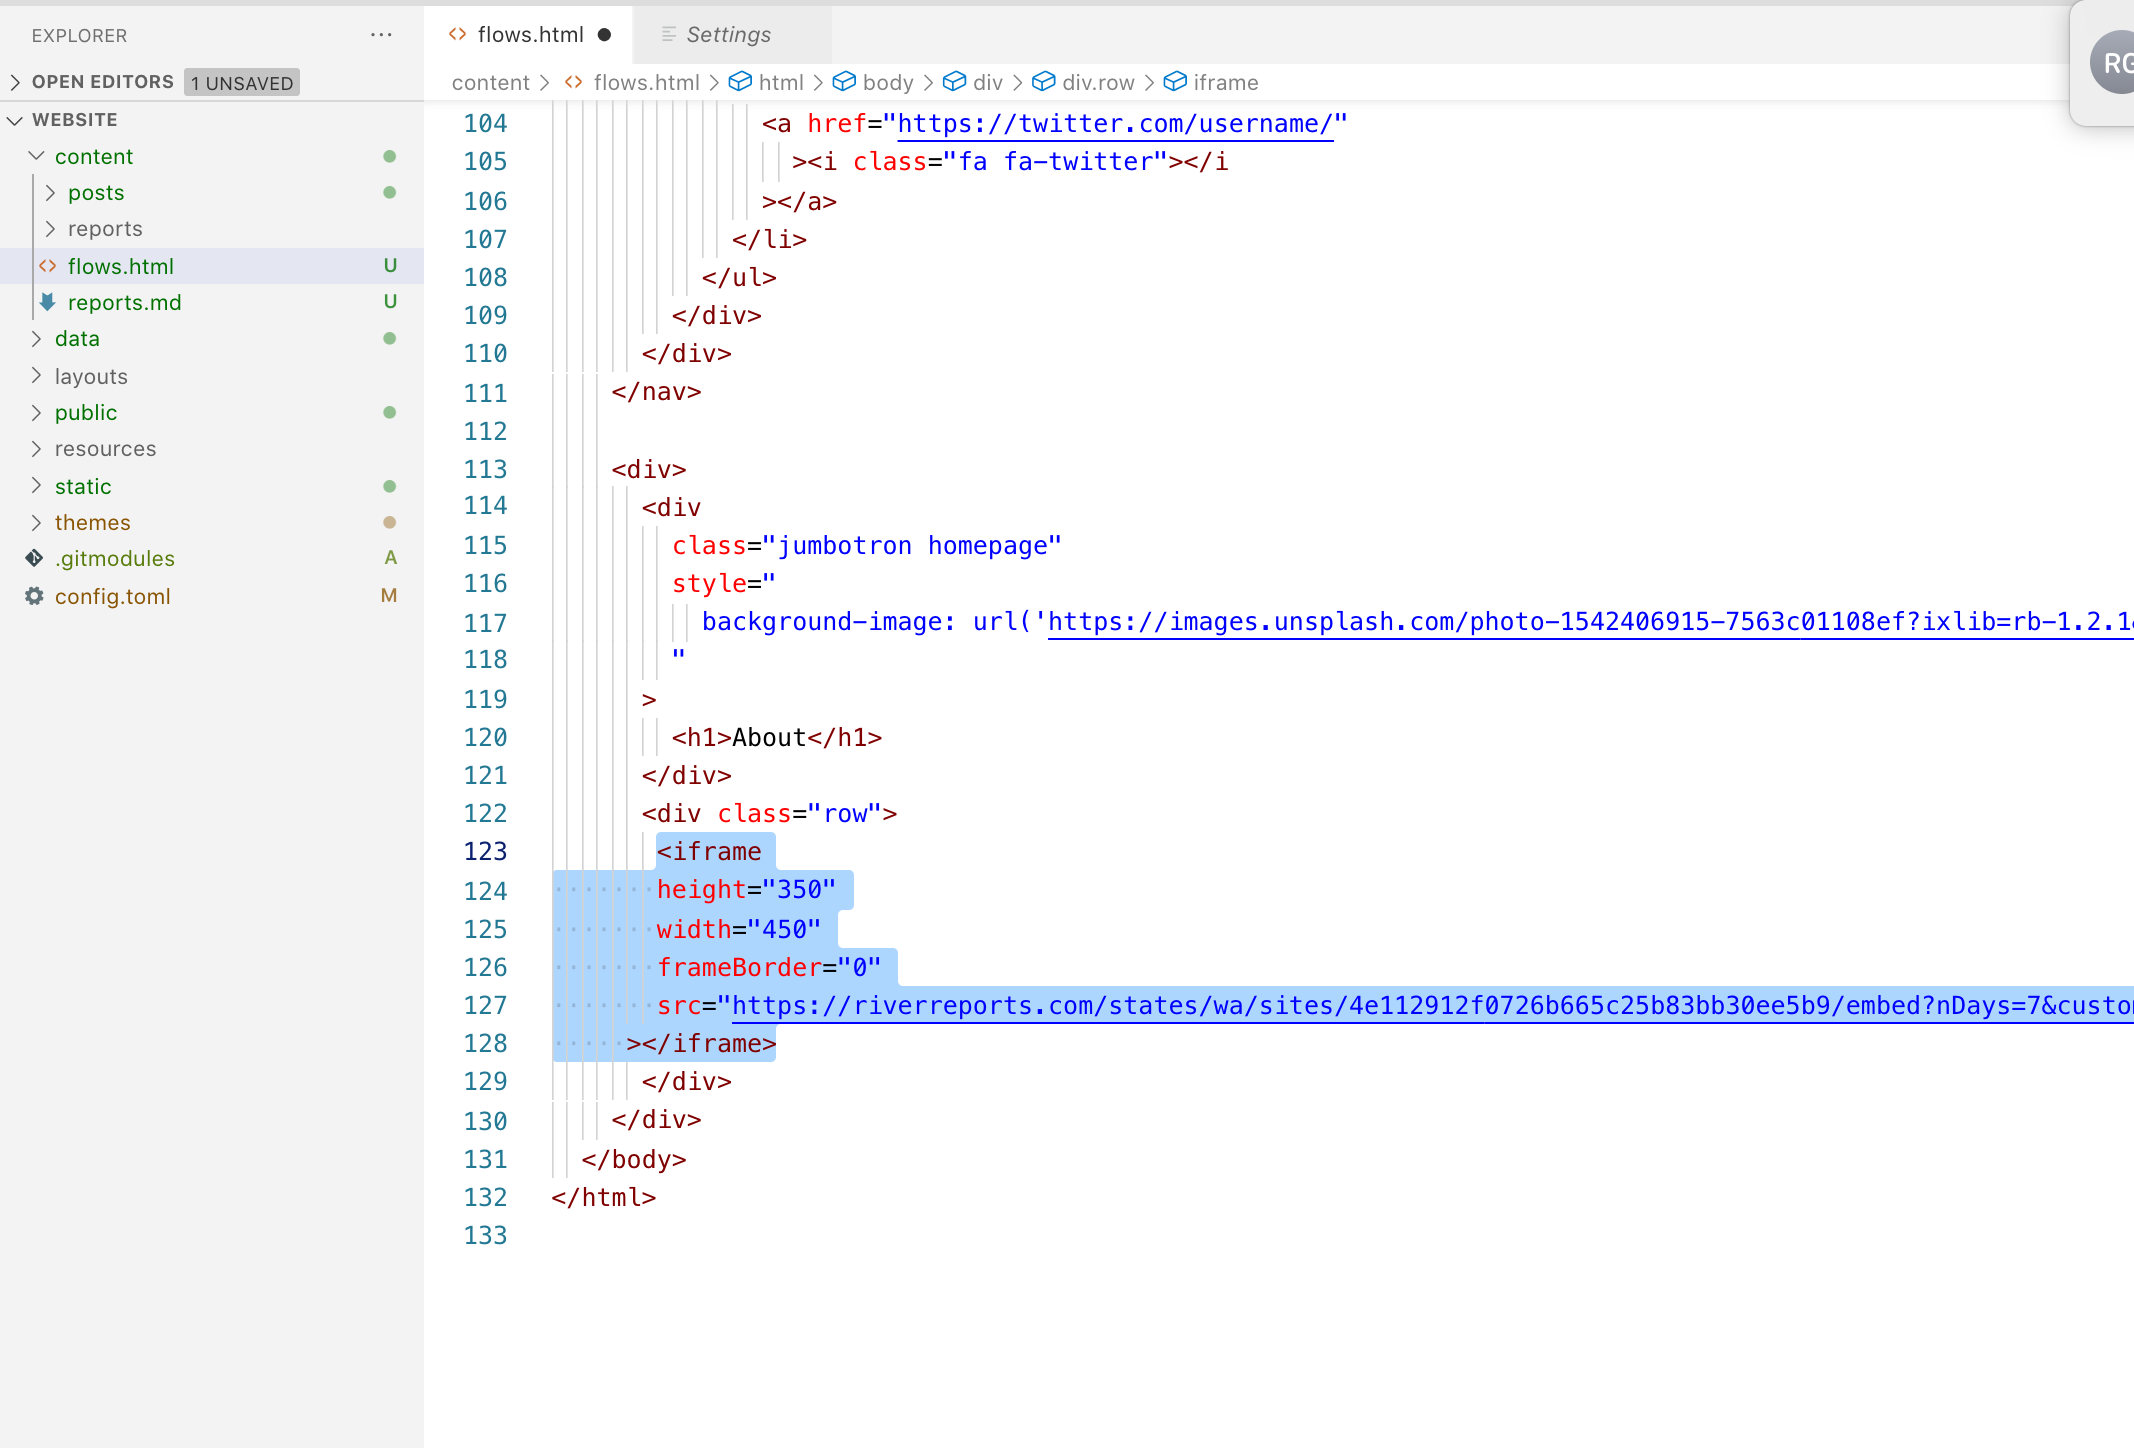
1. Determine the page you'd like to add the chart to. Find the HTML file or resource associated with that page.
2. Visit the page of the flow you'd like to embed on your site.
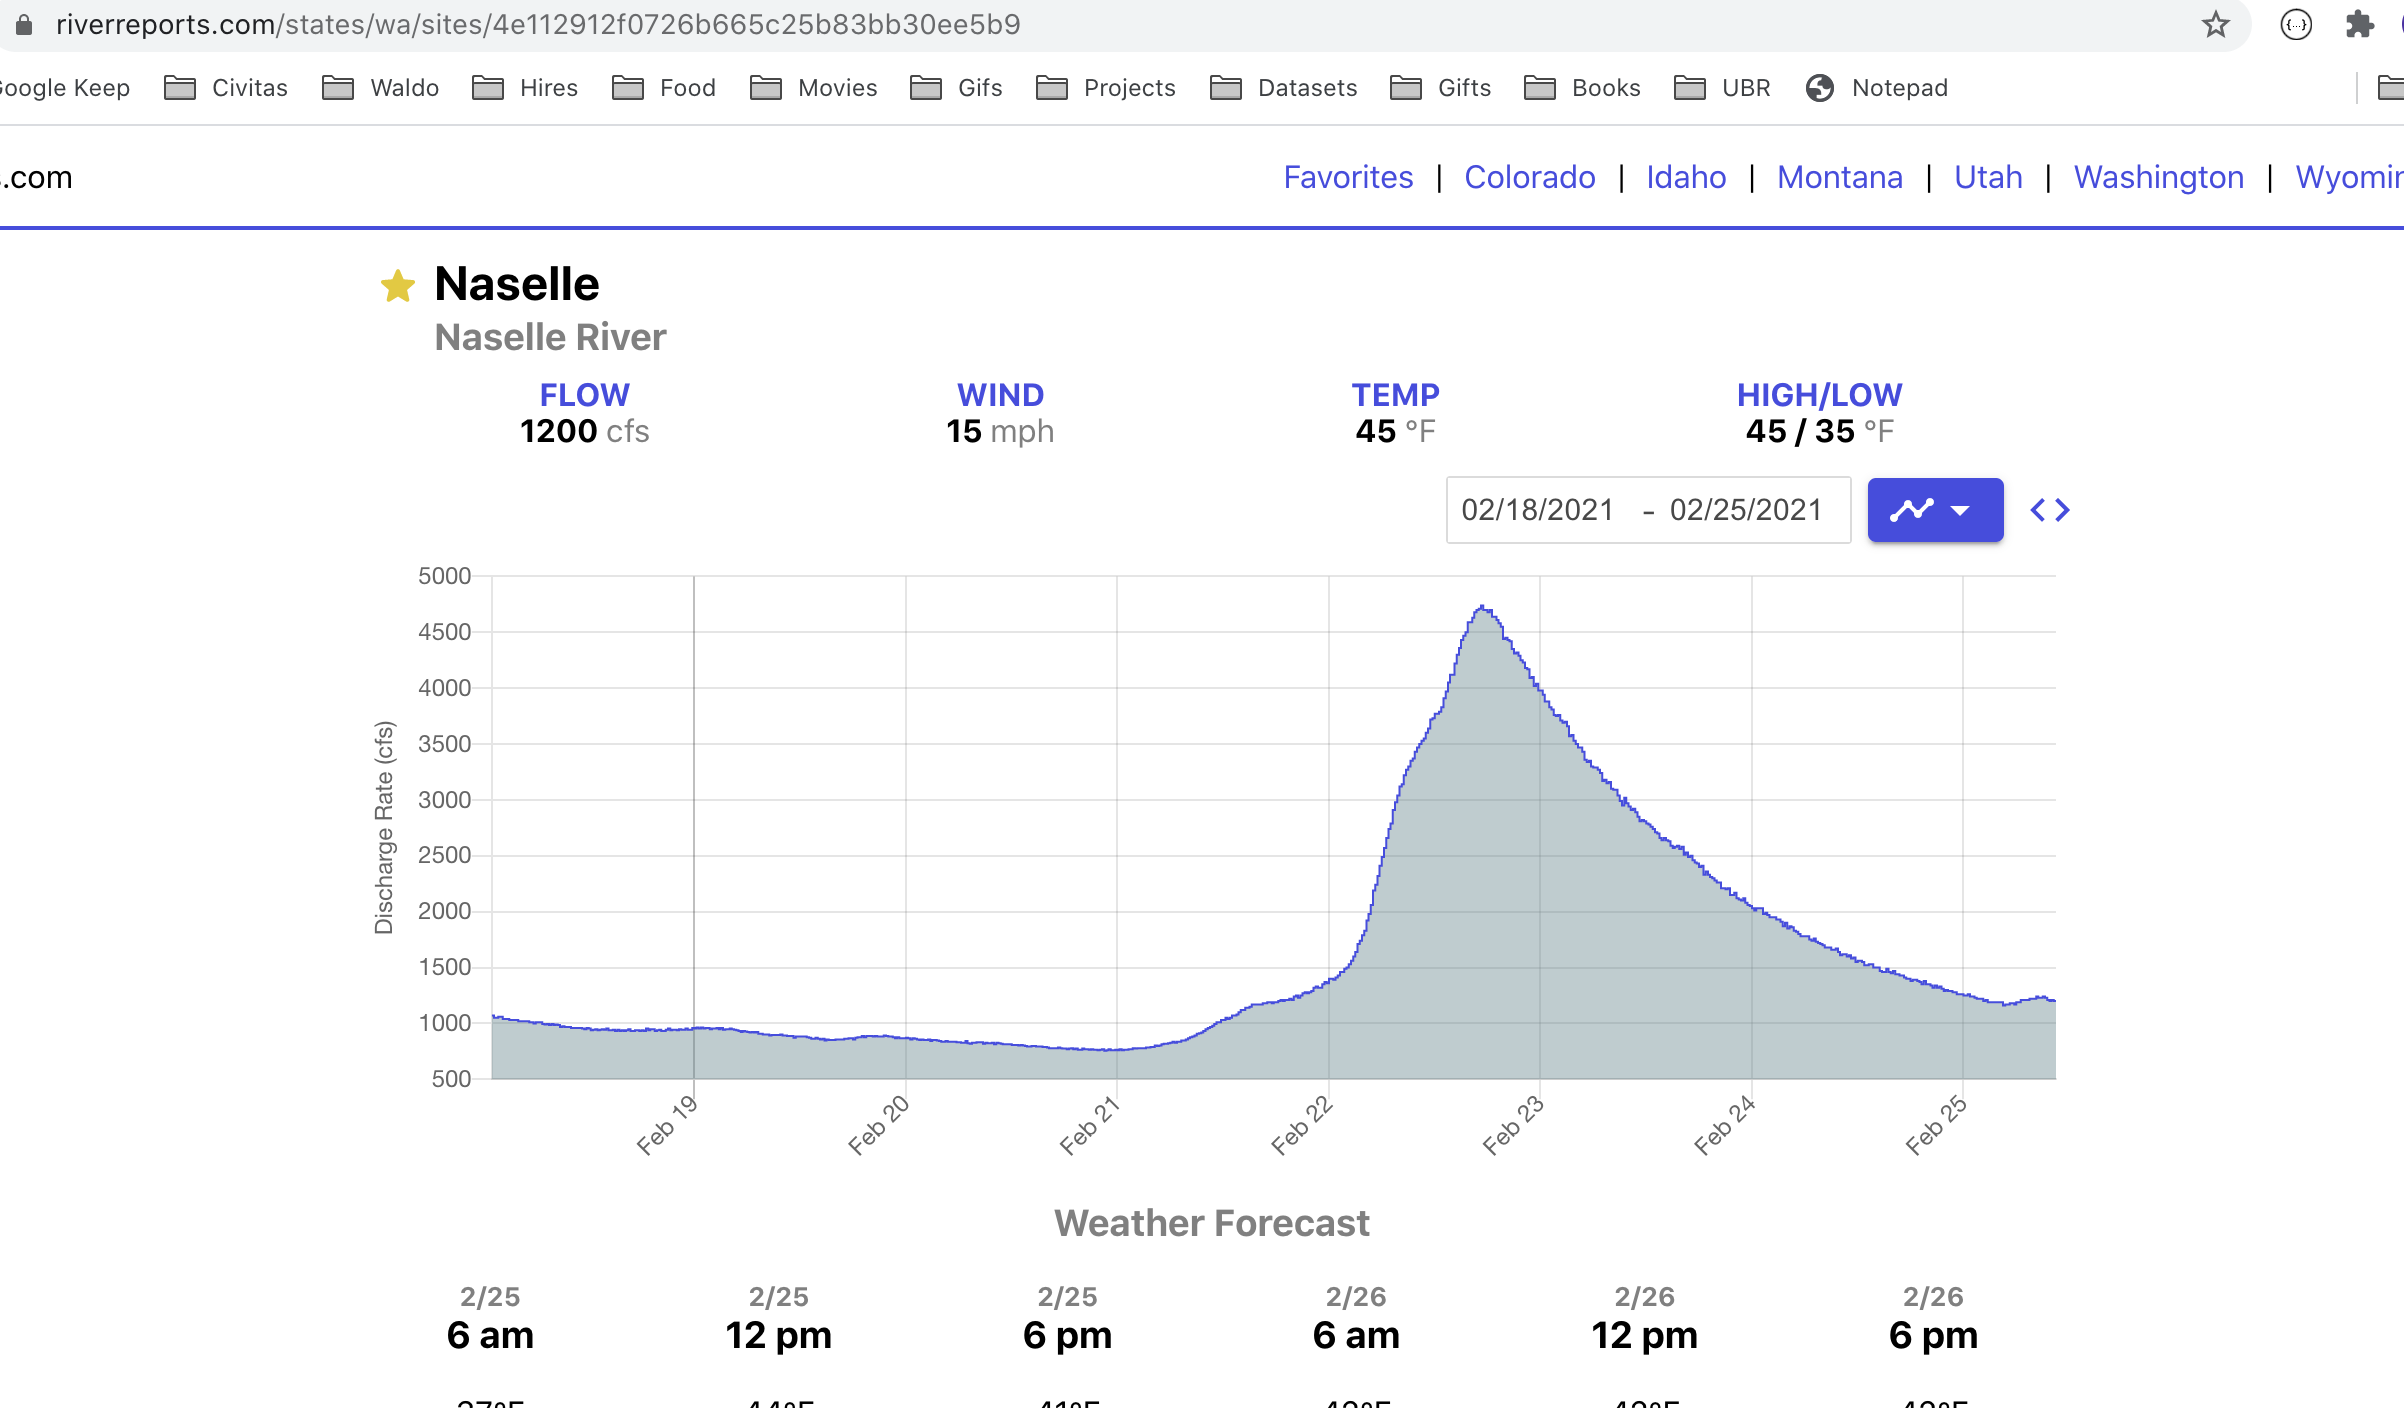
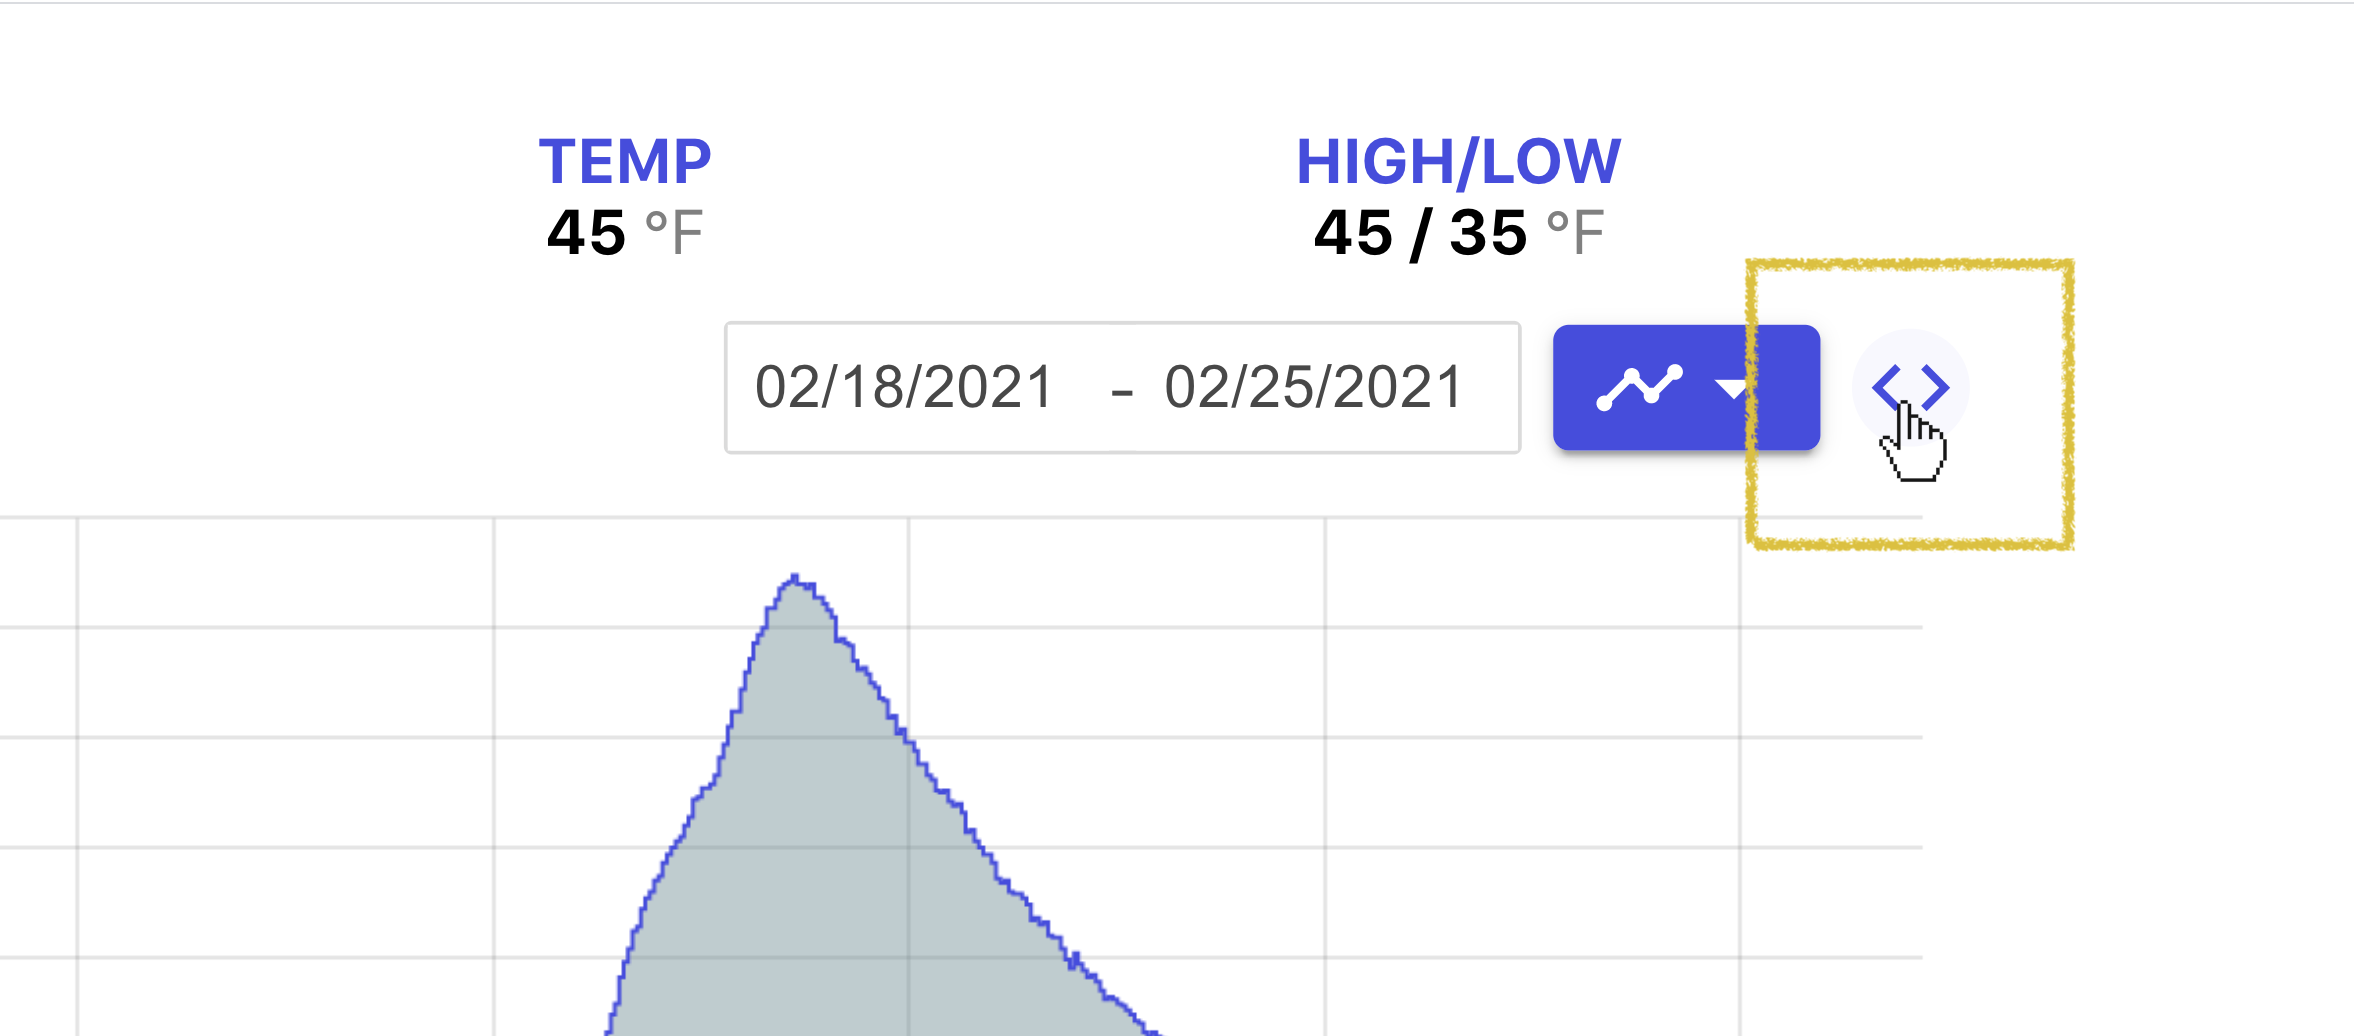
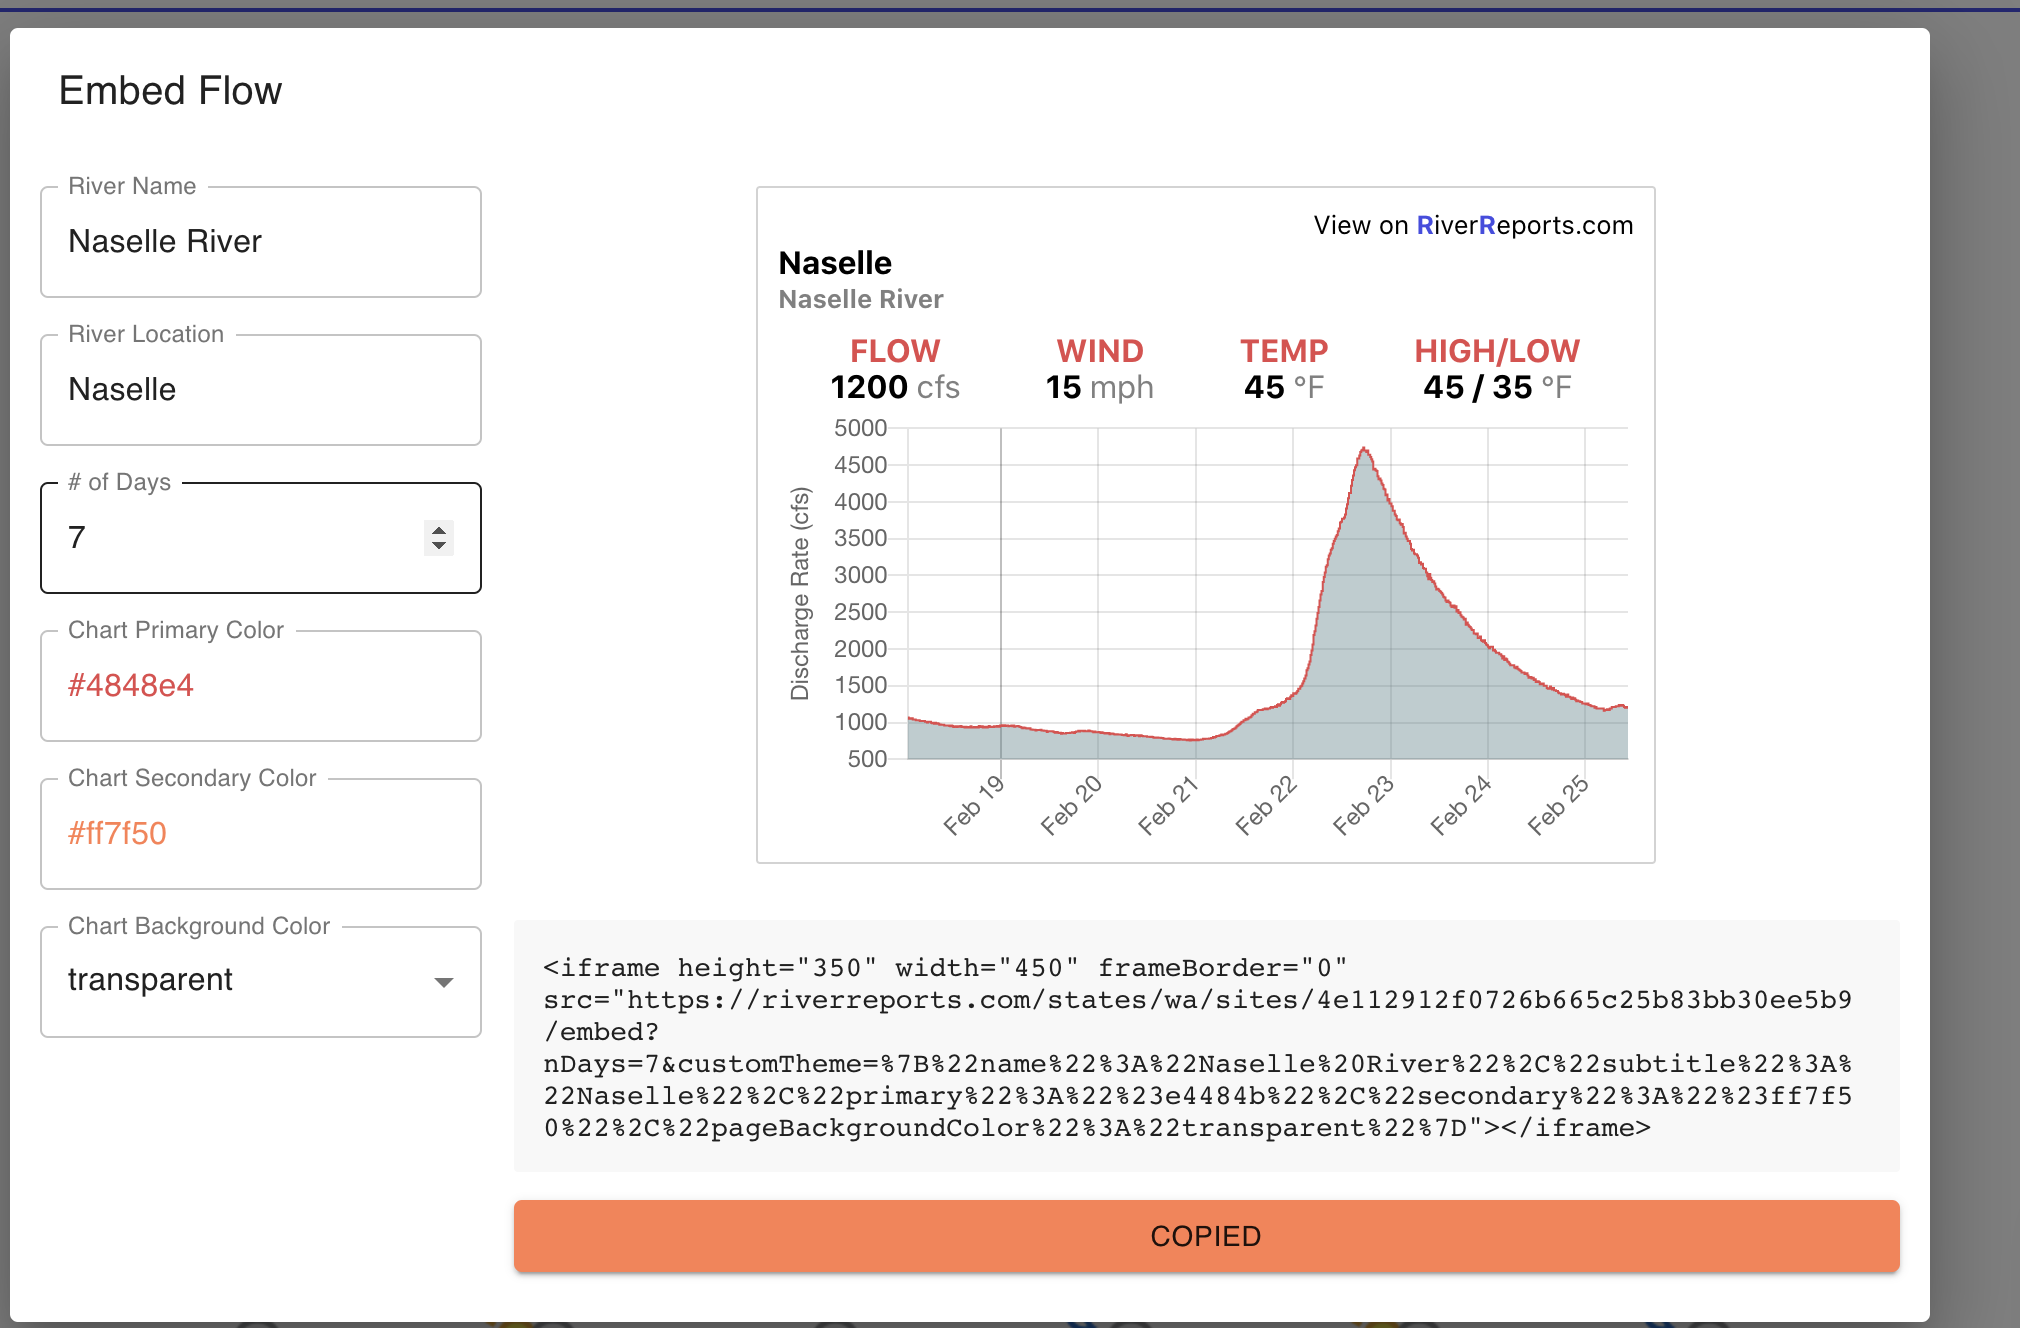
3. Click the embed button located to the upper right of the chart (see the yellow square in the image to the right). Note that this button is only displayed on larger screen sizes.
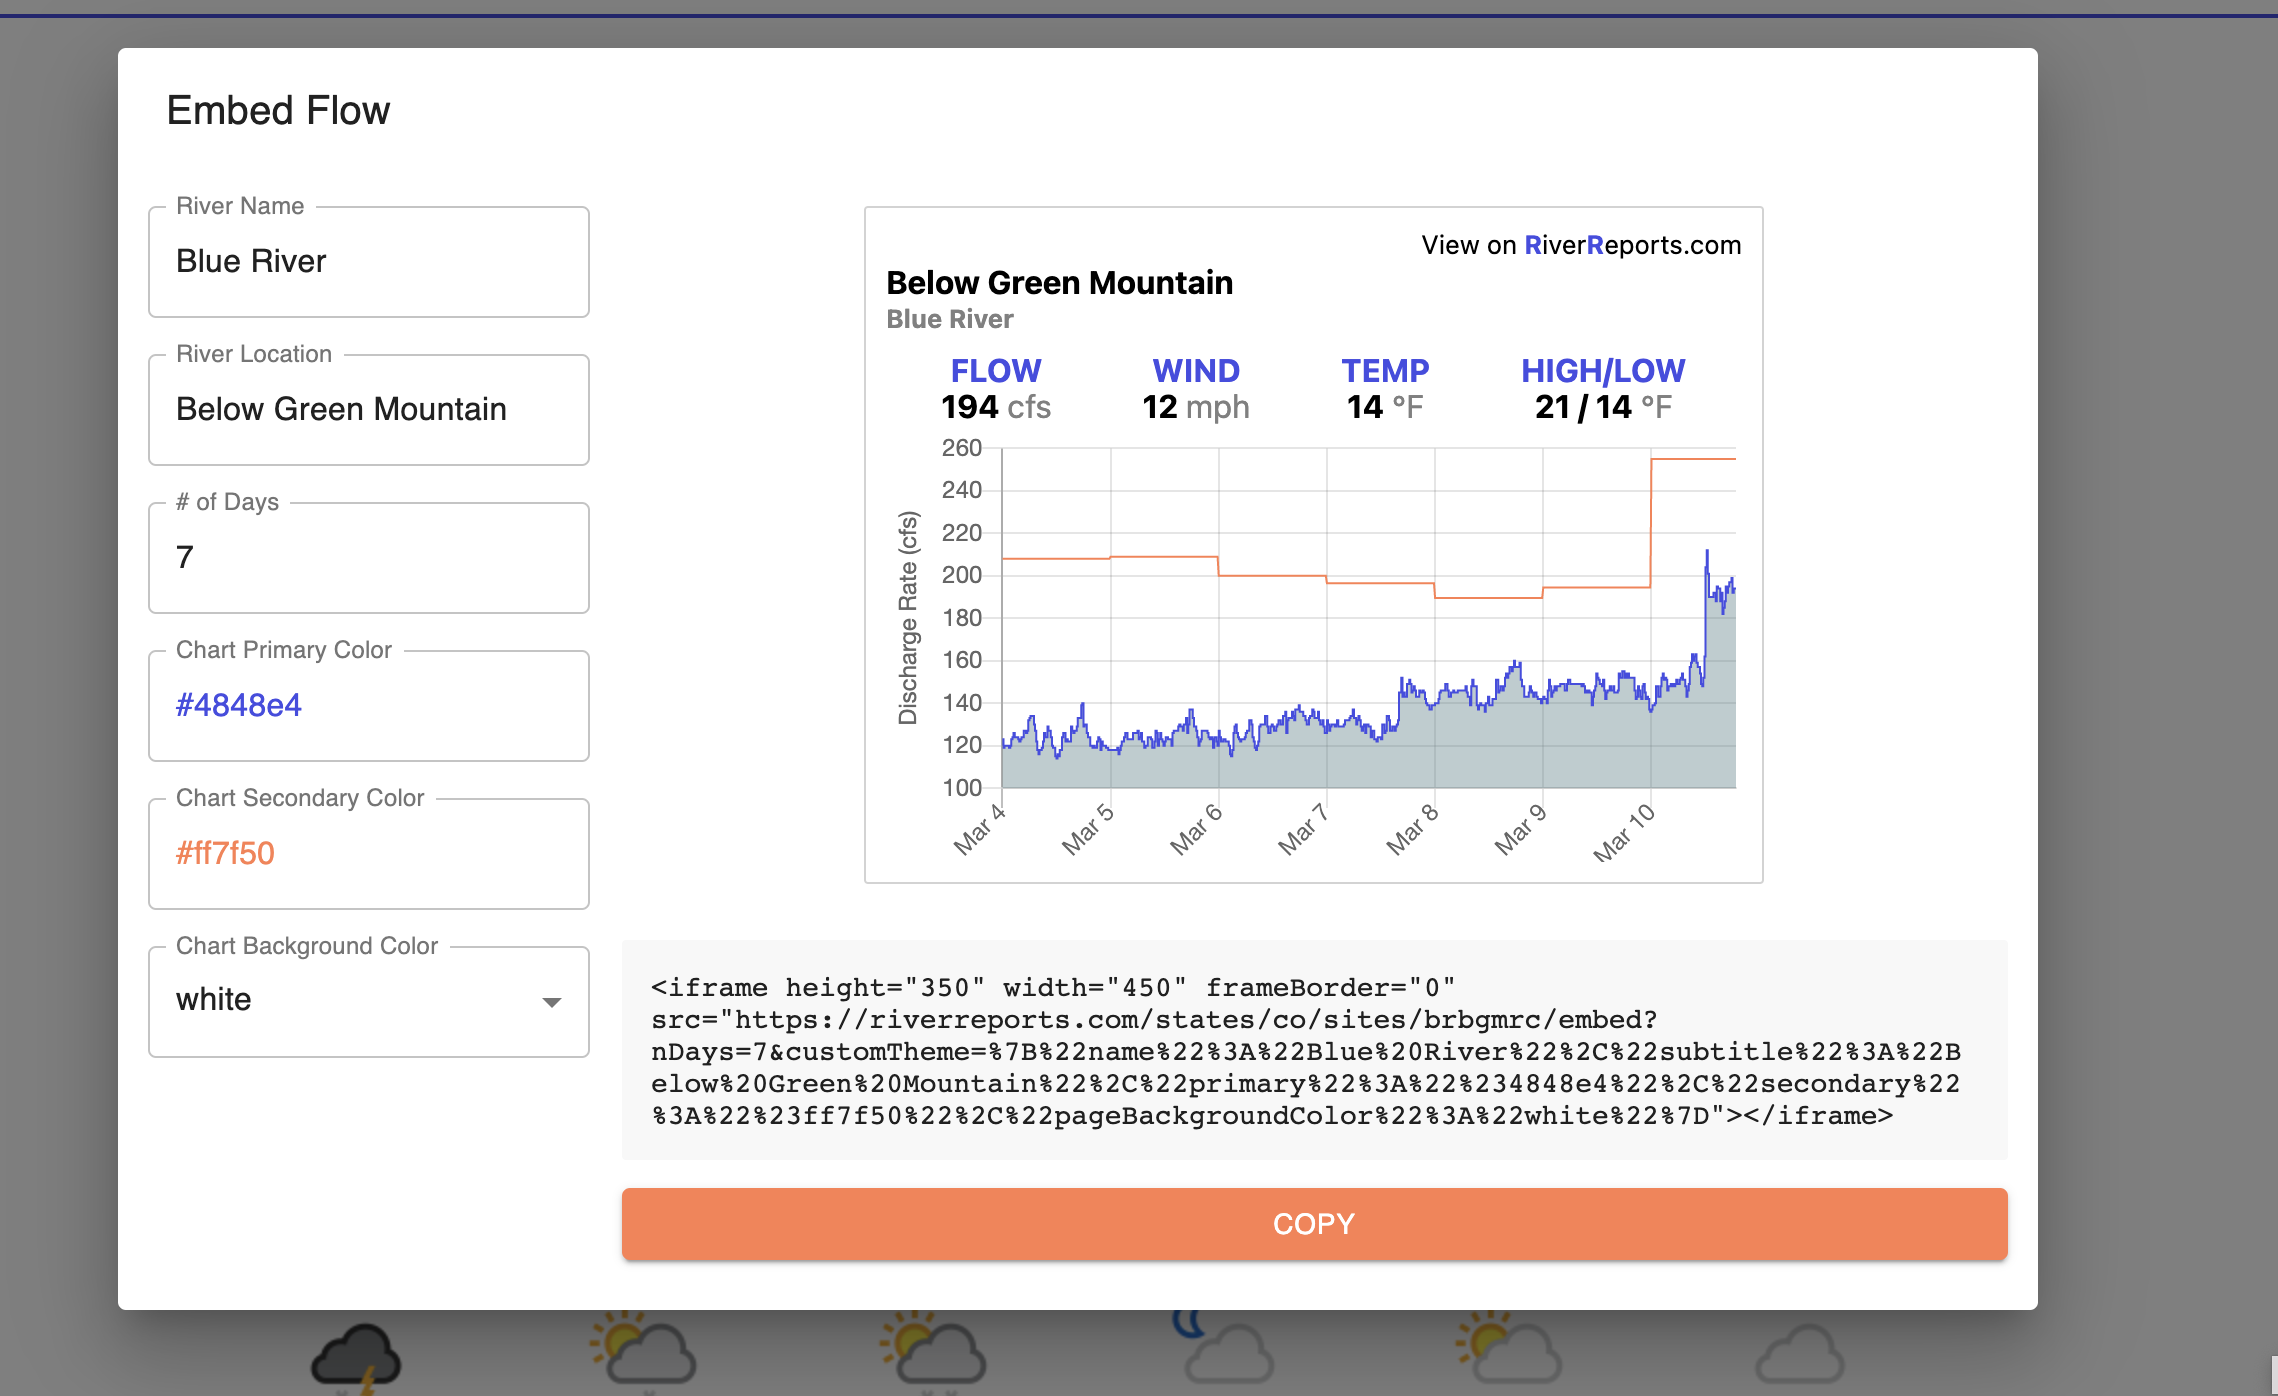
4. Use the Embed Modal to customize the look, feel, and data that will be displayed in your chart. Any customizations you make will appear in the preview on the right.
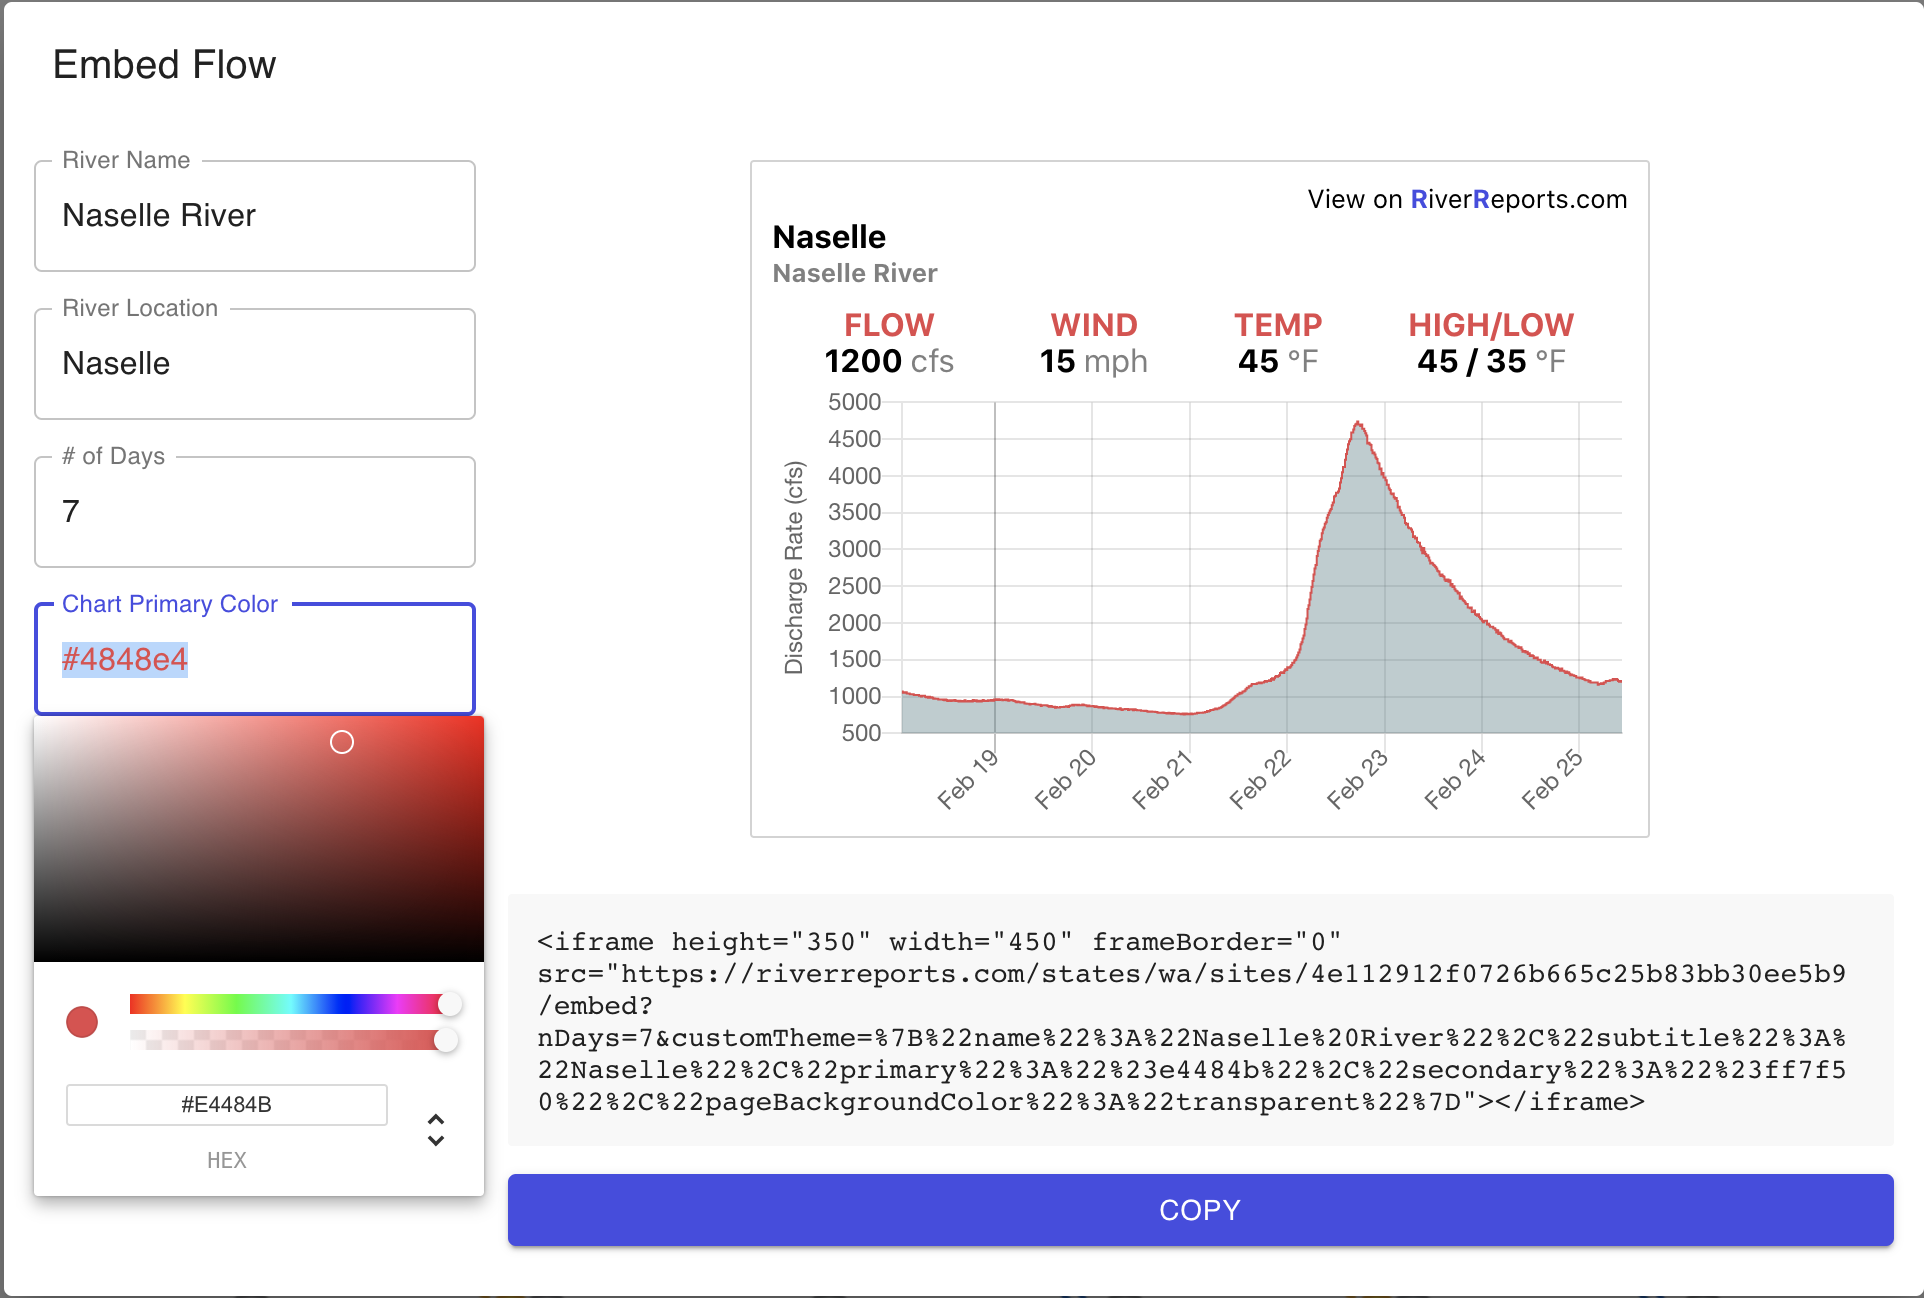
5. Click the Copy button to copy the embed code to your clipboard.
6. Paste the embed code into your HTML file. Adjust the height and width as needed using the height and width attributes of the iframe.
7. That's it! Save the file and refresh the page.
WordPress
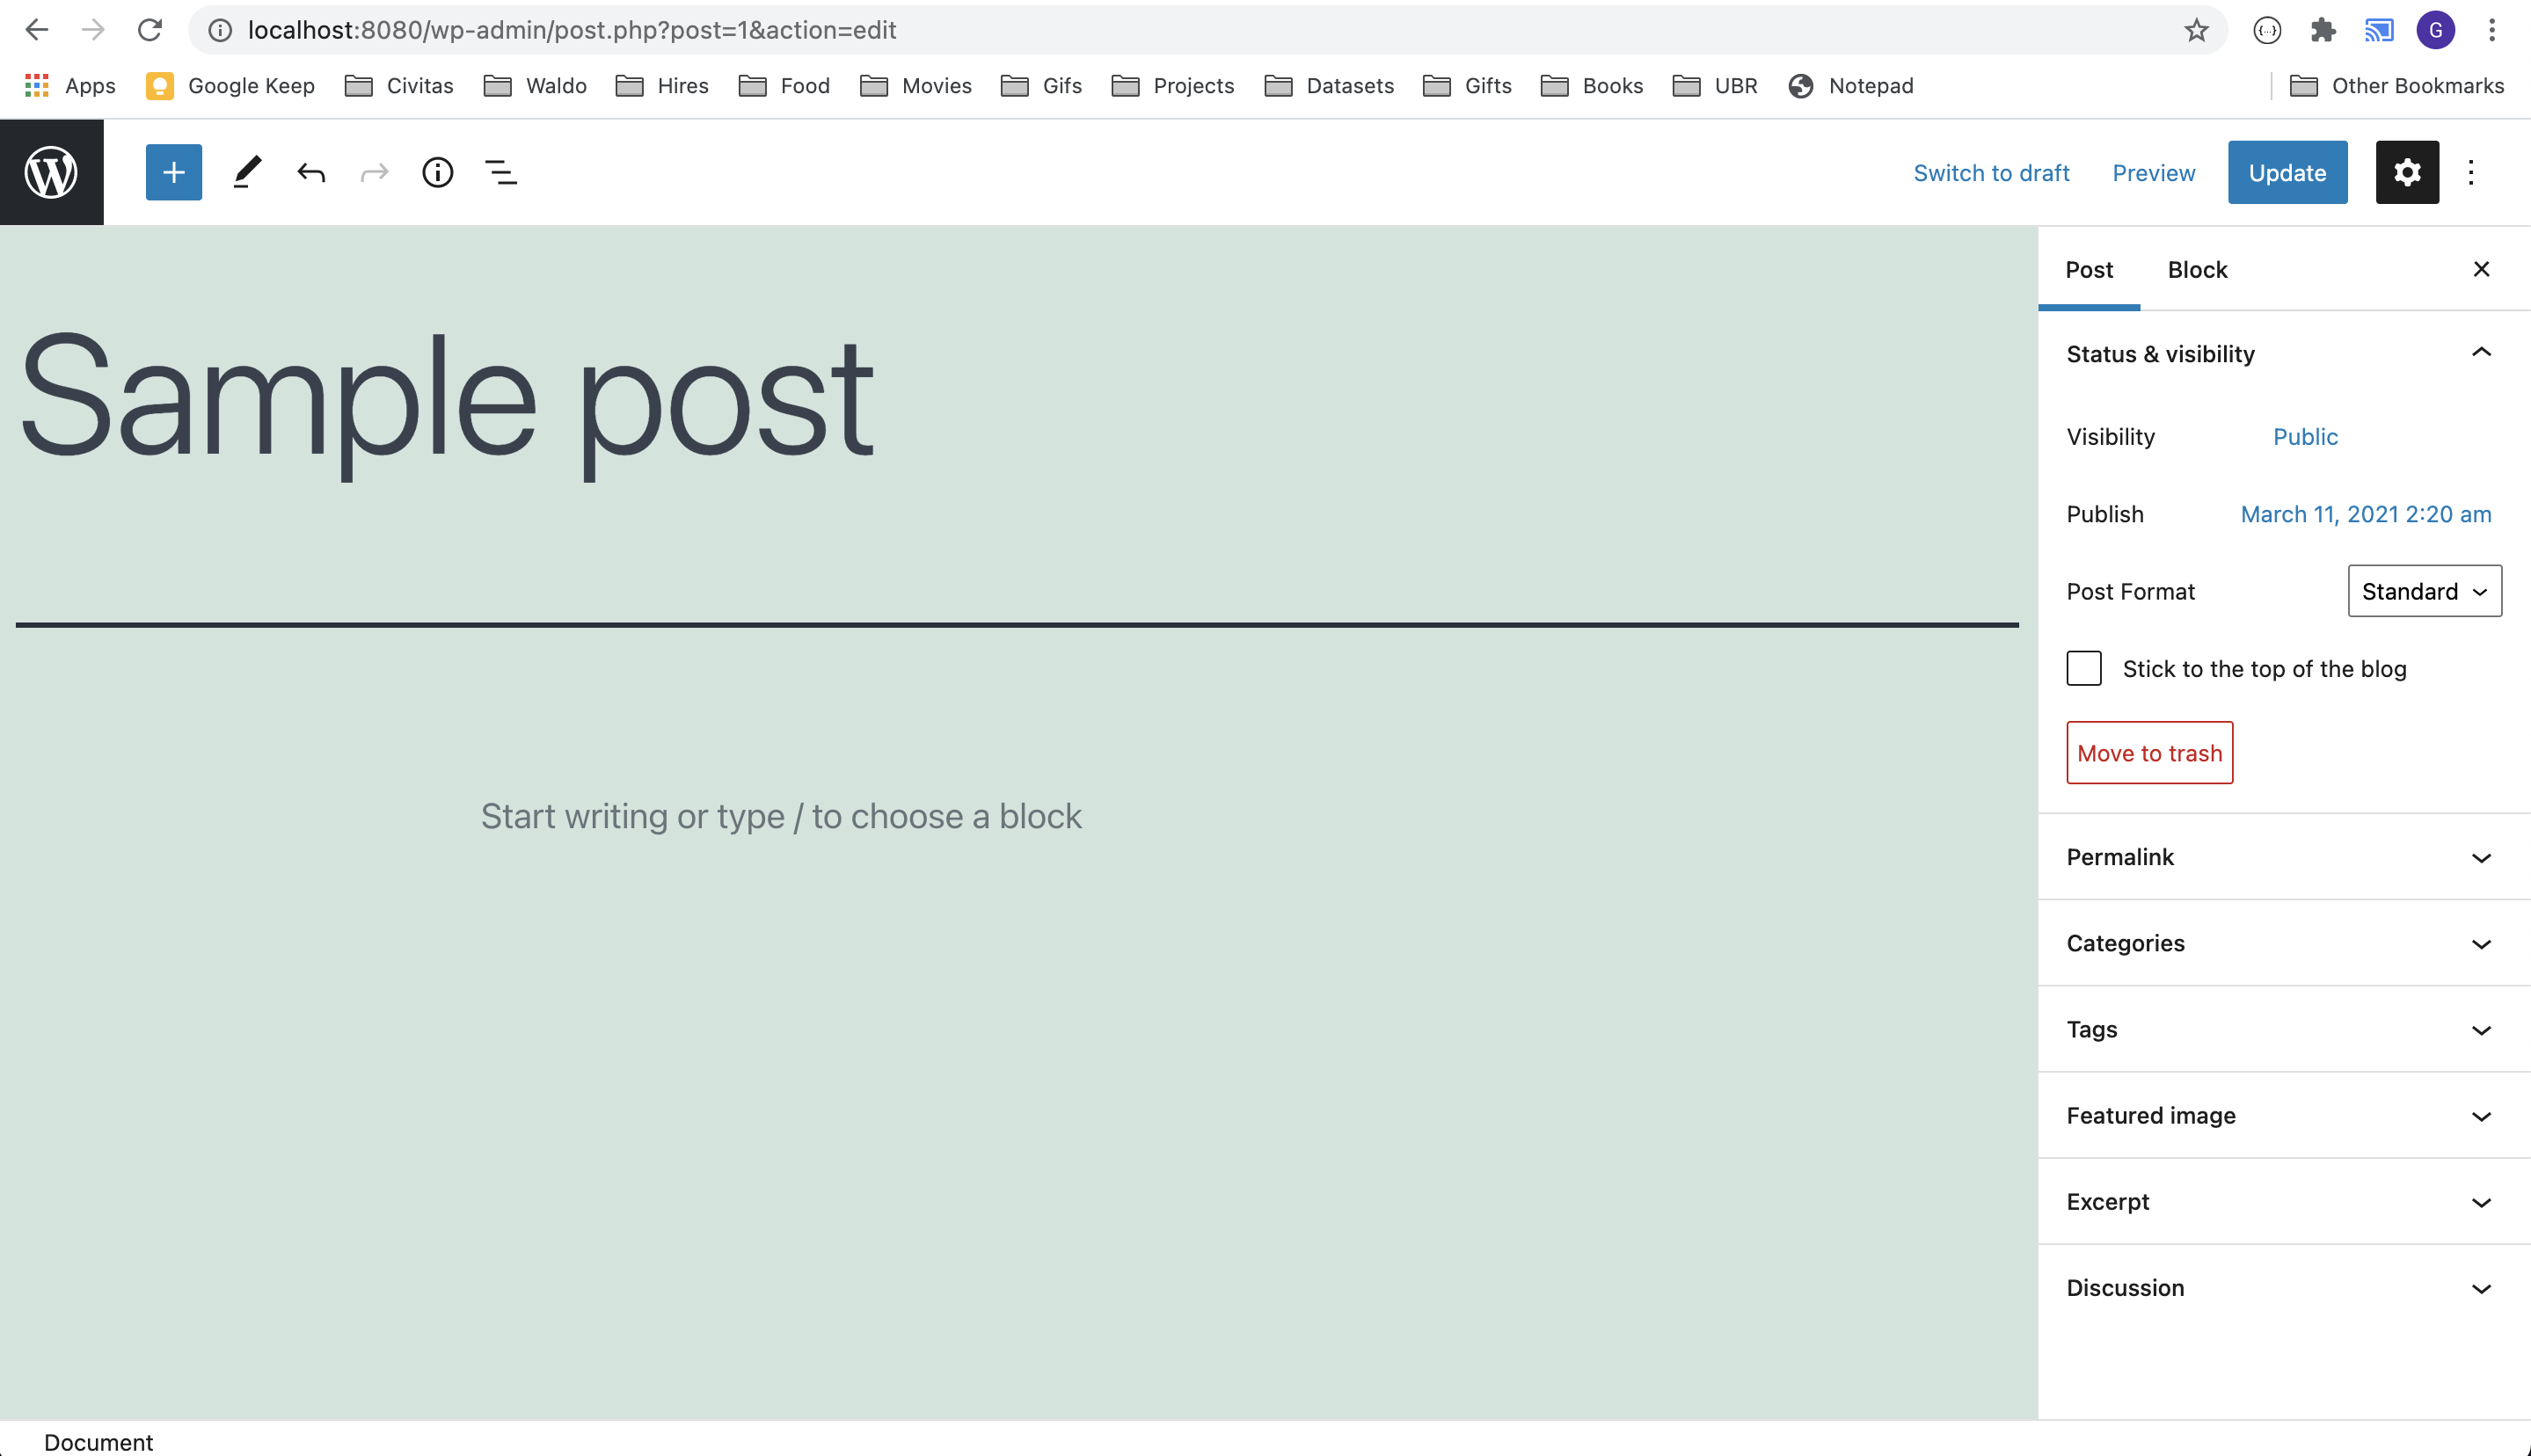
1. Determine the post or page you'd like to add the chart to. Click to edit the page.
2. Visit the page of the flow you'd like to embed on your site.
3. Click the embed button located to the upper right of the chart (see the yellow square in the image to the right). Note that this button is only displayed on larger screen sizes.
4. Click the Copy button to copy the embed code to your clipboard.
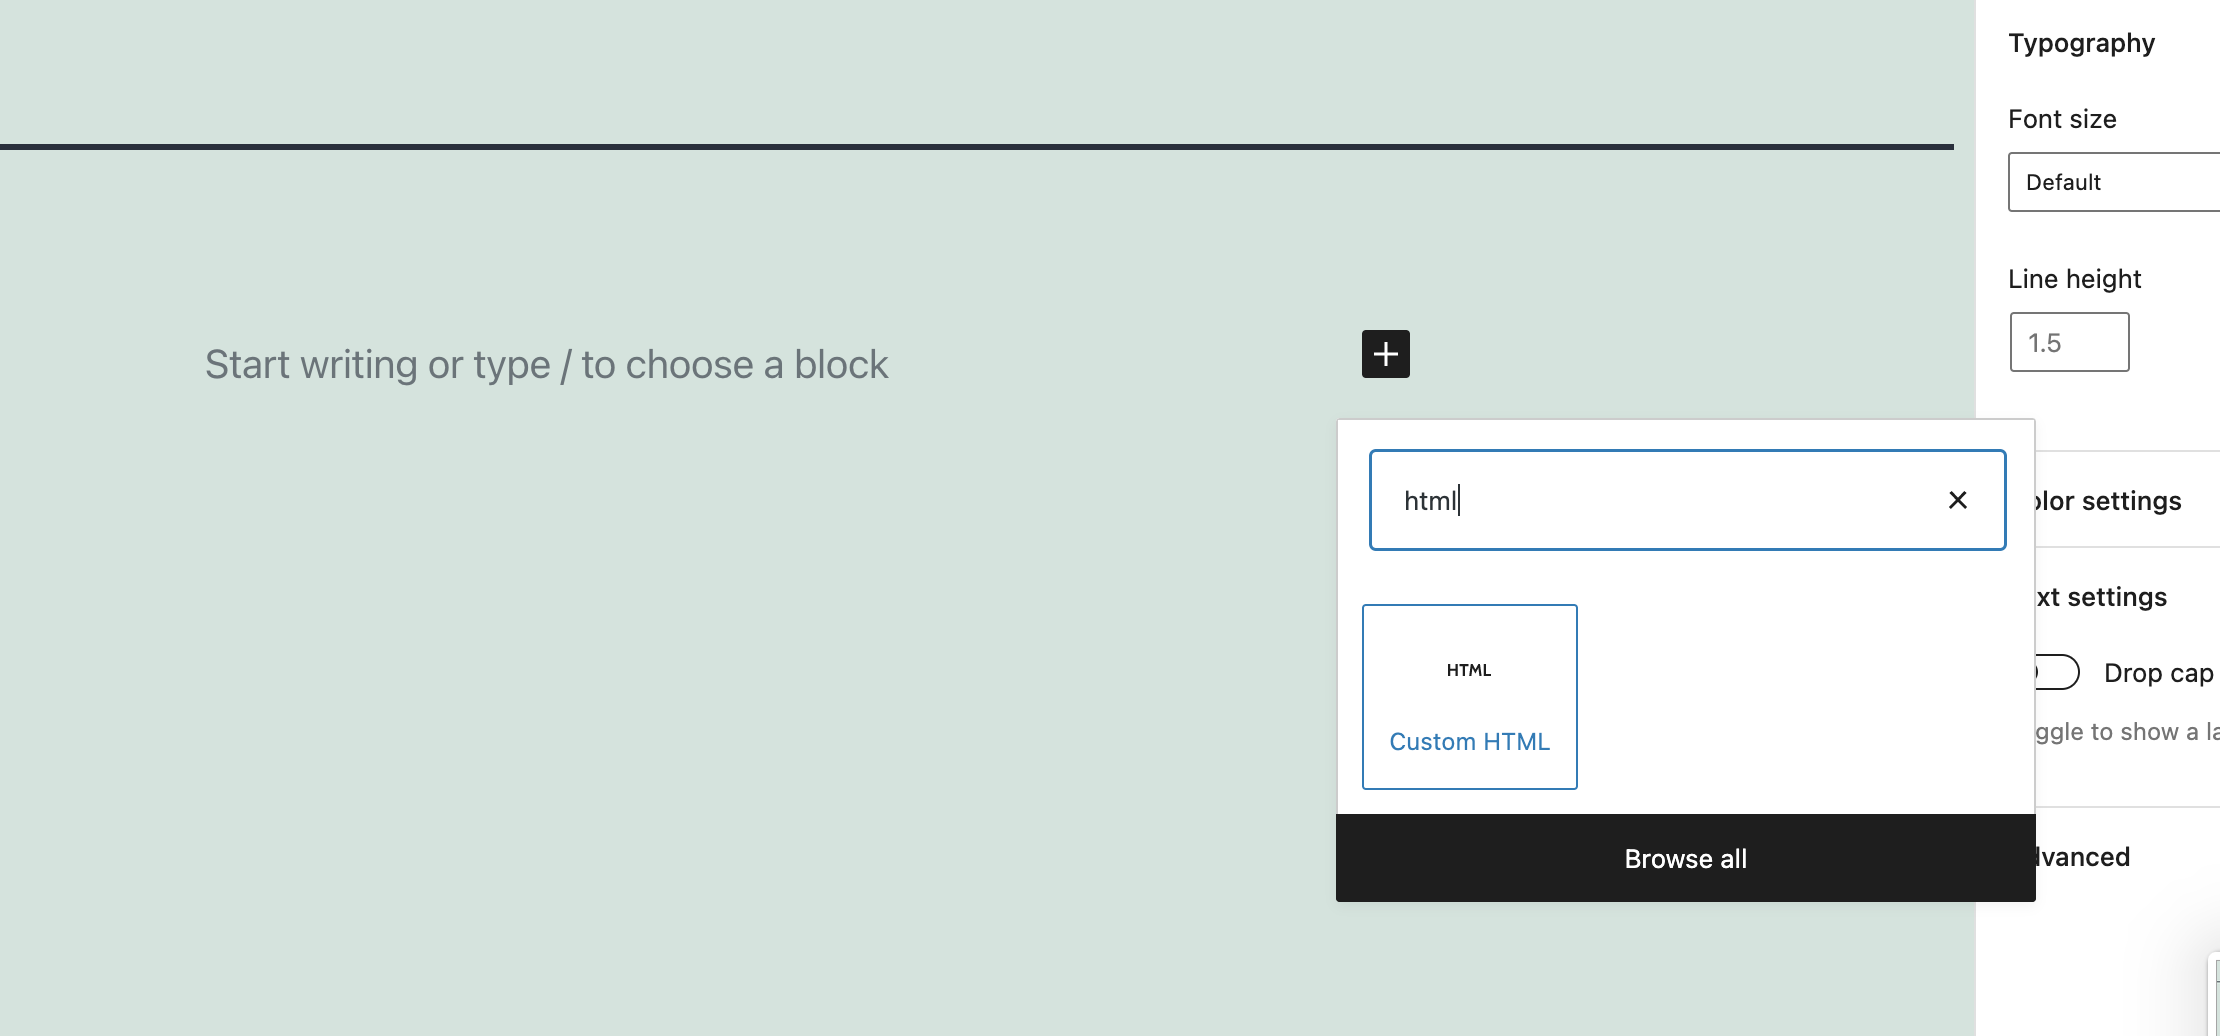
4. Return to WordPress. Click the Add block icon, filter to Custom HTML, and select it.
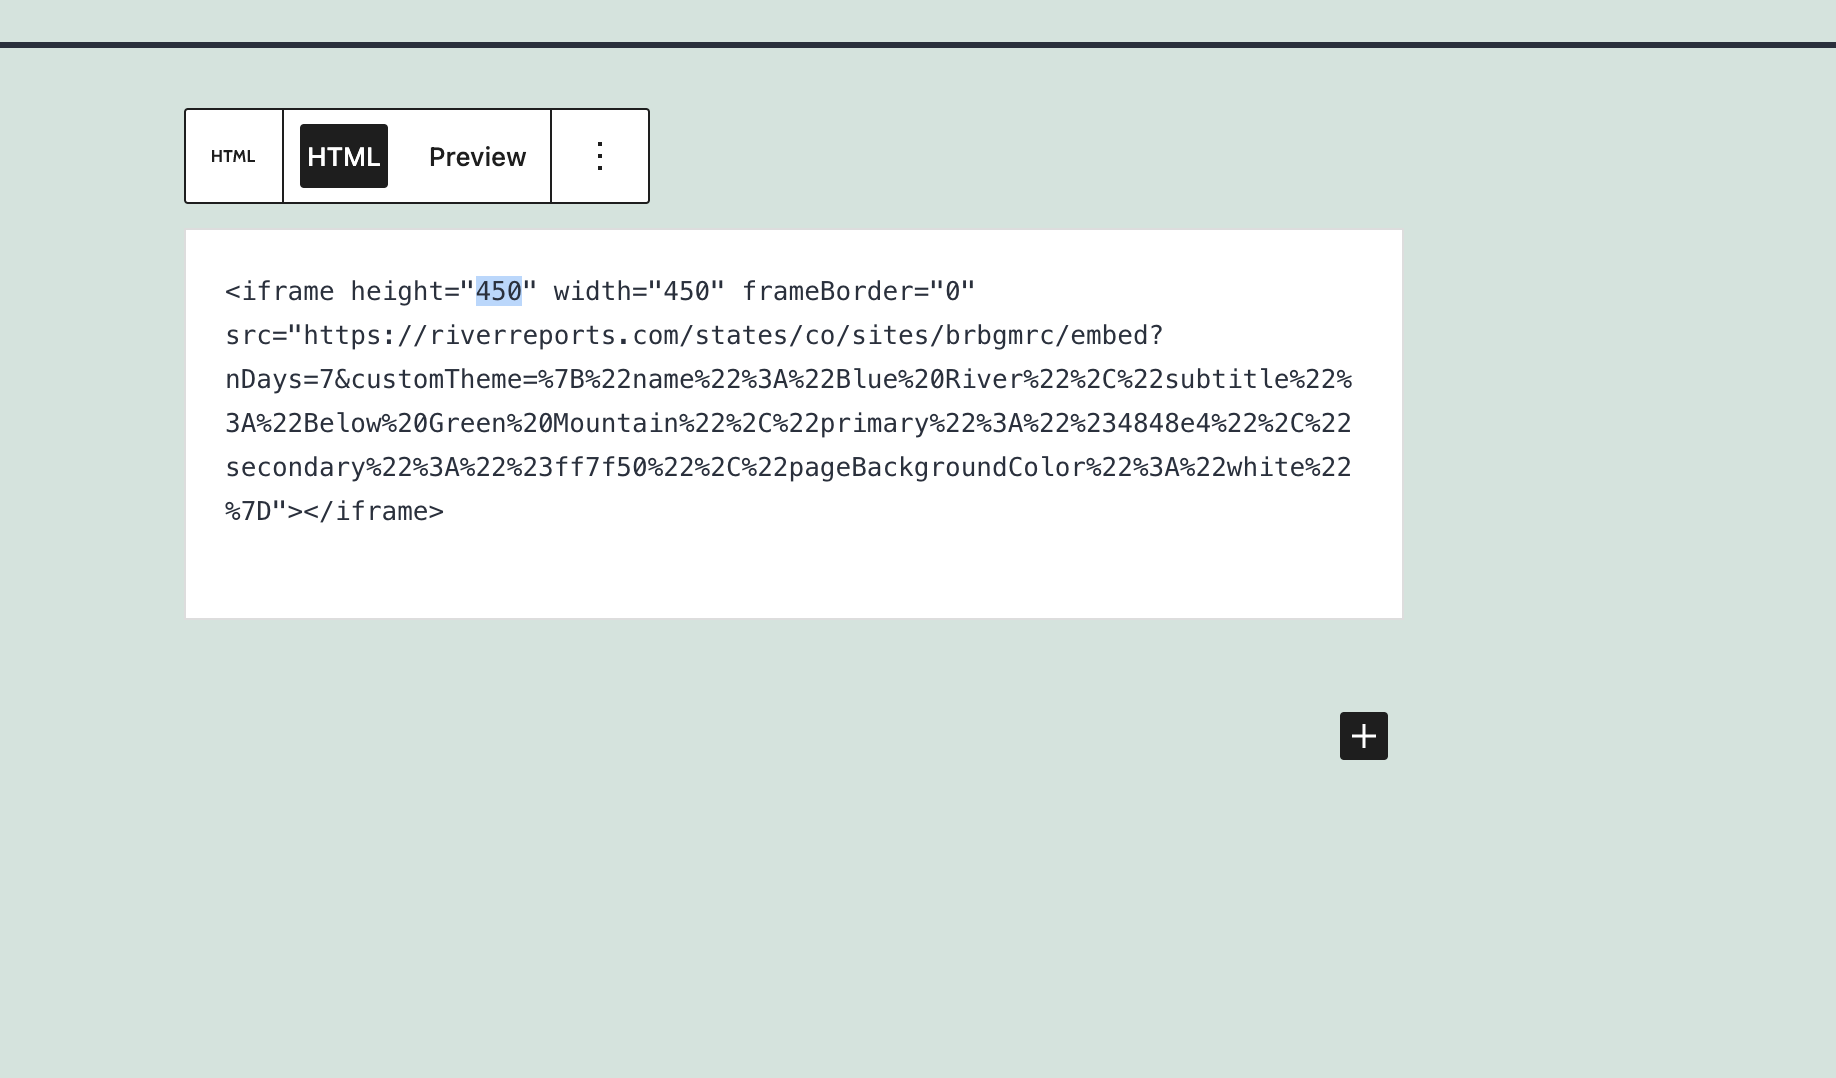
5. Paste the embed code into the HTML widget. Adjust the height and width as needed using the height and width attributes of the iframe.
6. That's all! Your chart will be displayed.
Squarespace
1. Determine the page you'd like to add the chart to.
2. Visit the page of the flow you'd like to embed on your site.
3. Click the embed button located to the upper right of the chart (see the yellow square in the image to the right). Note that this button is only displayed on larger screen sizes.
4. Click the Copy button to copy the embed code to your clipboard.
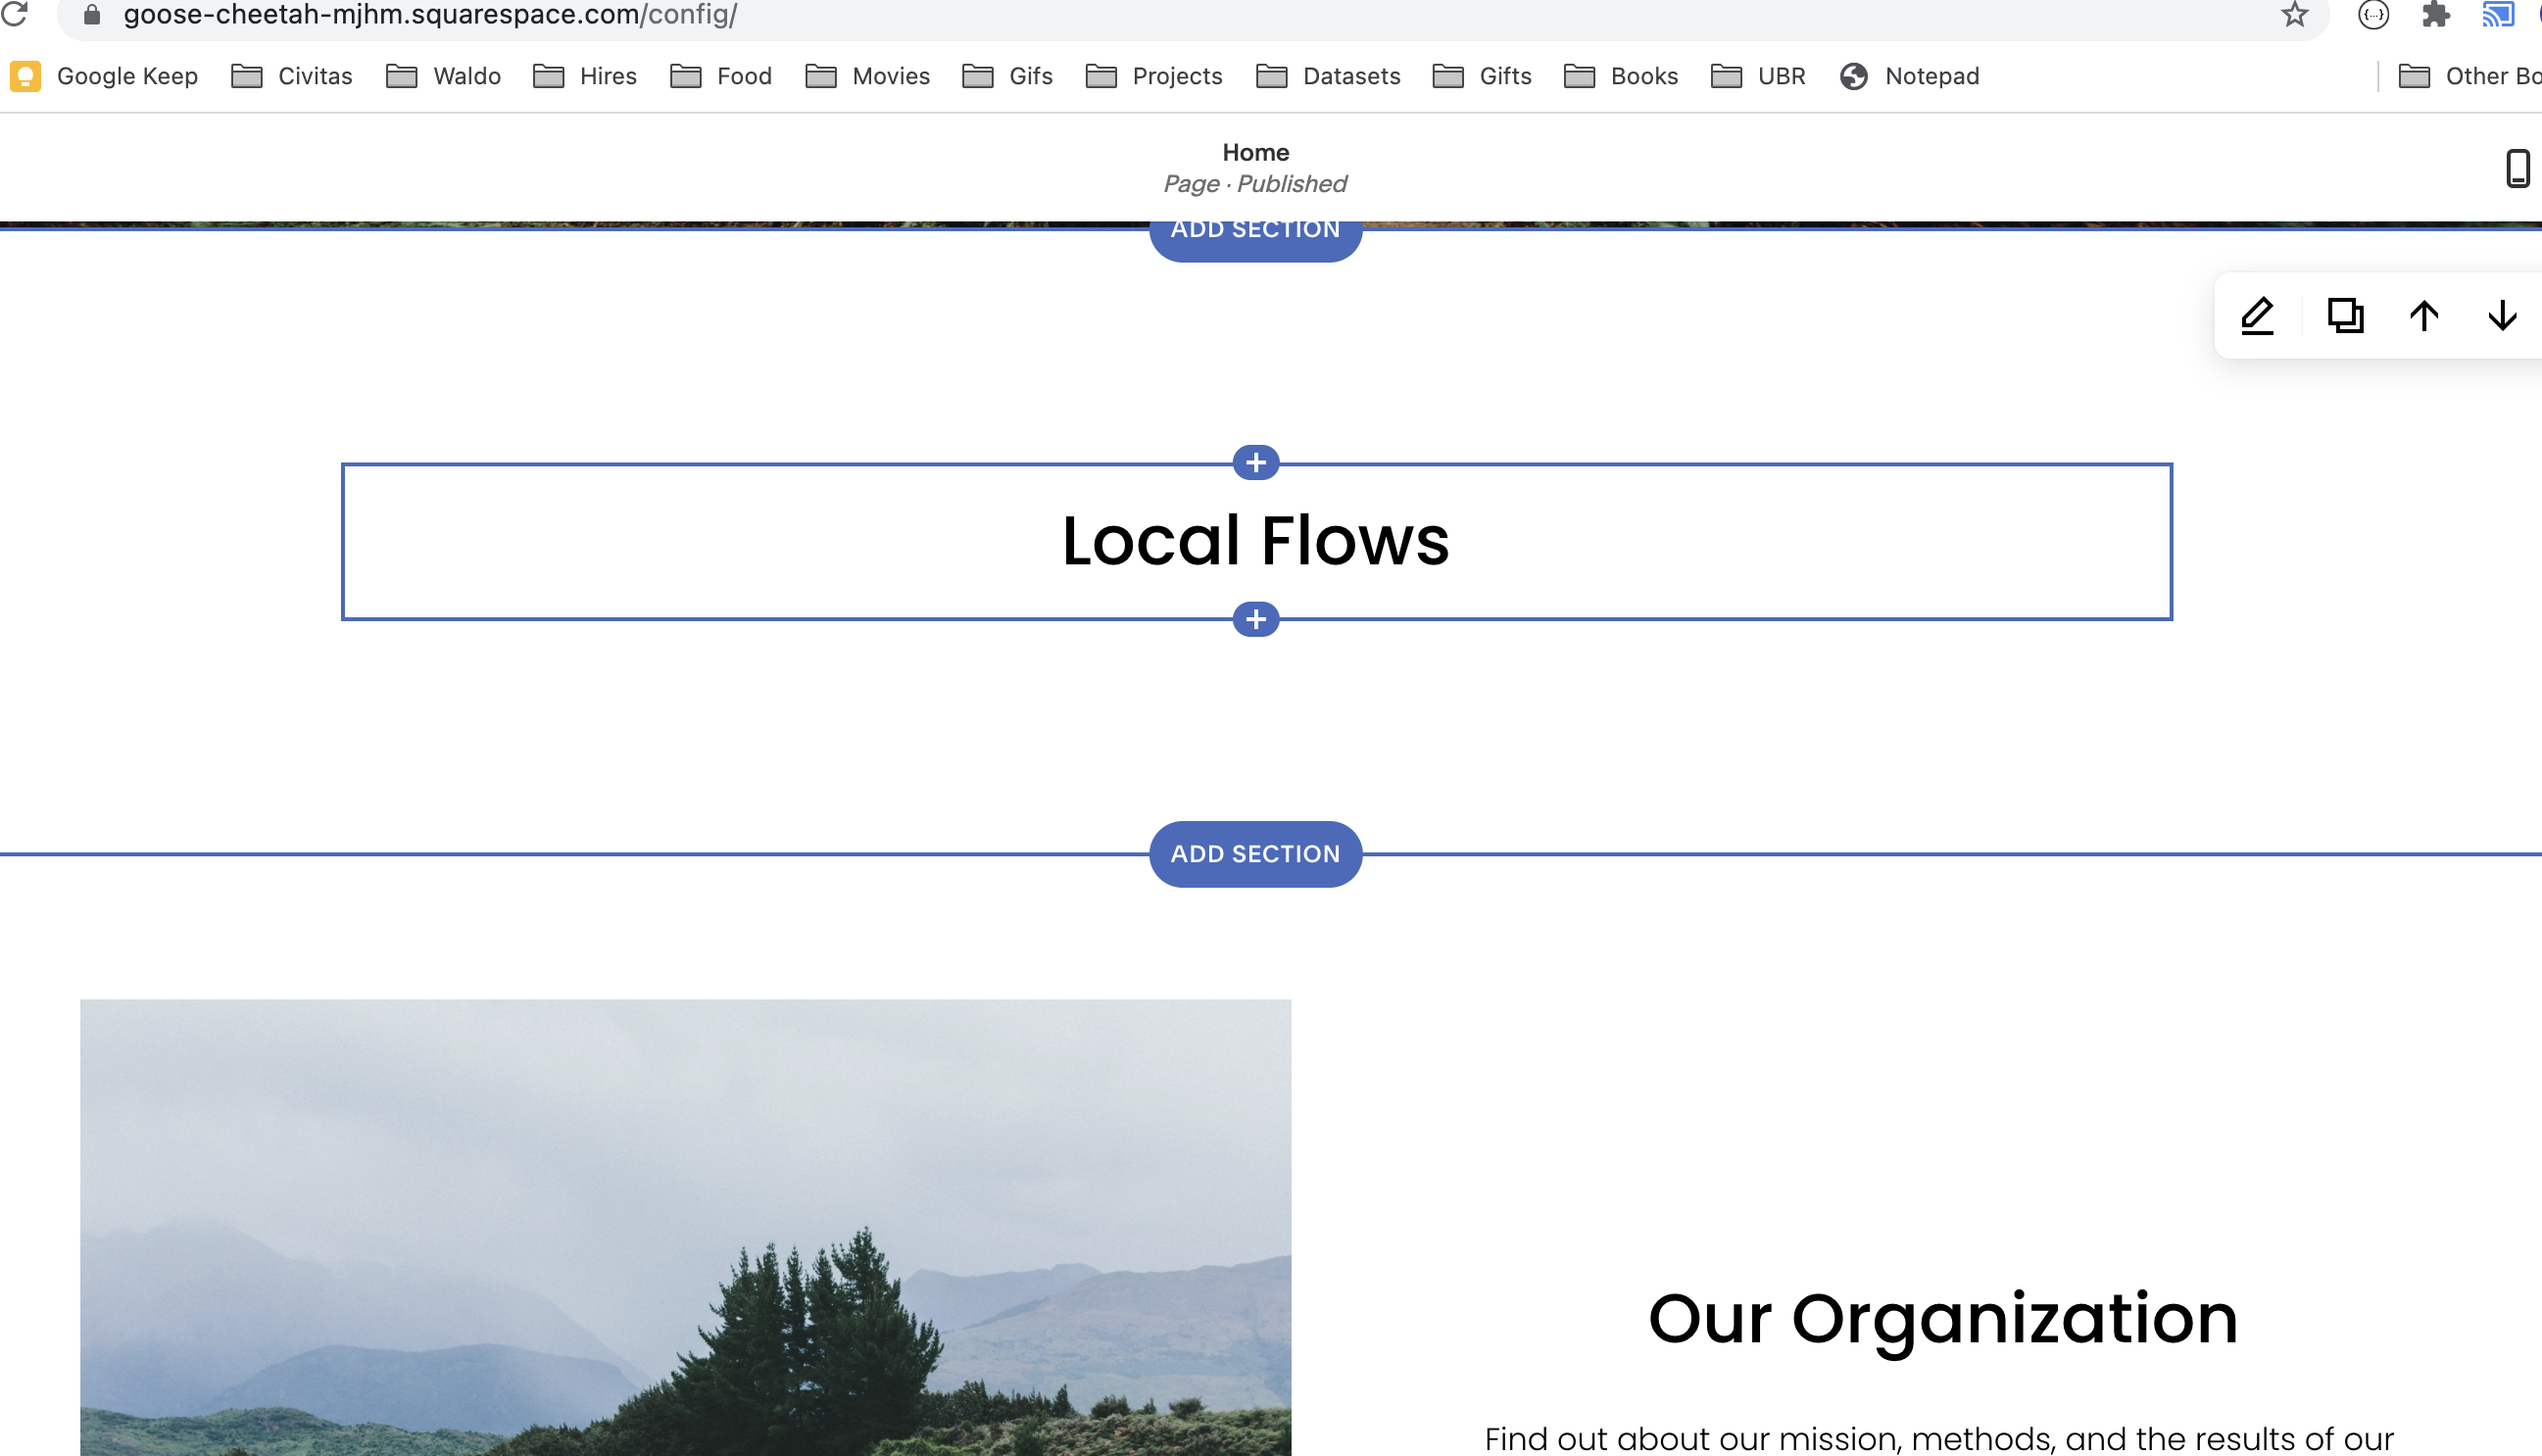
5. Return to Squarespace. Find the section you'd like to add the chart to. Click the Add block icon.

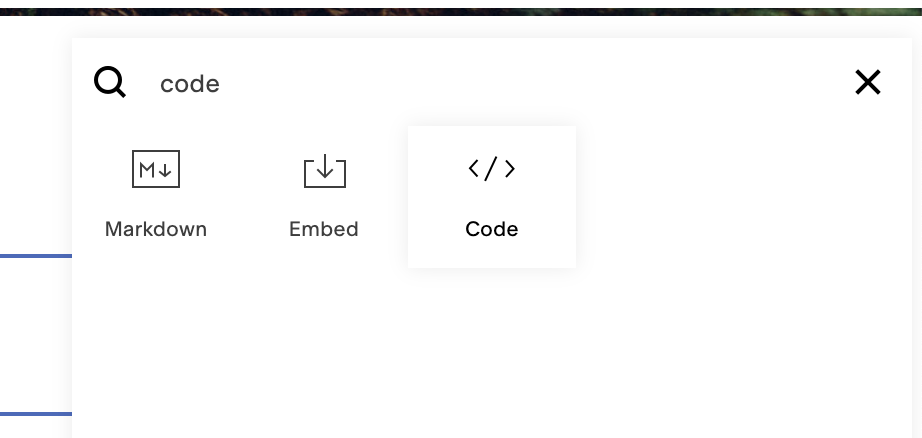
6. Filter to the Code block type and select it.
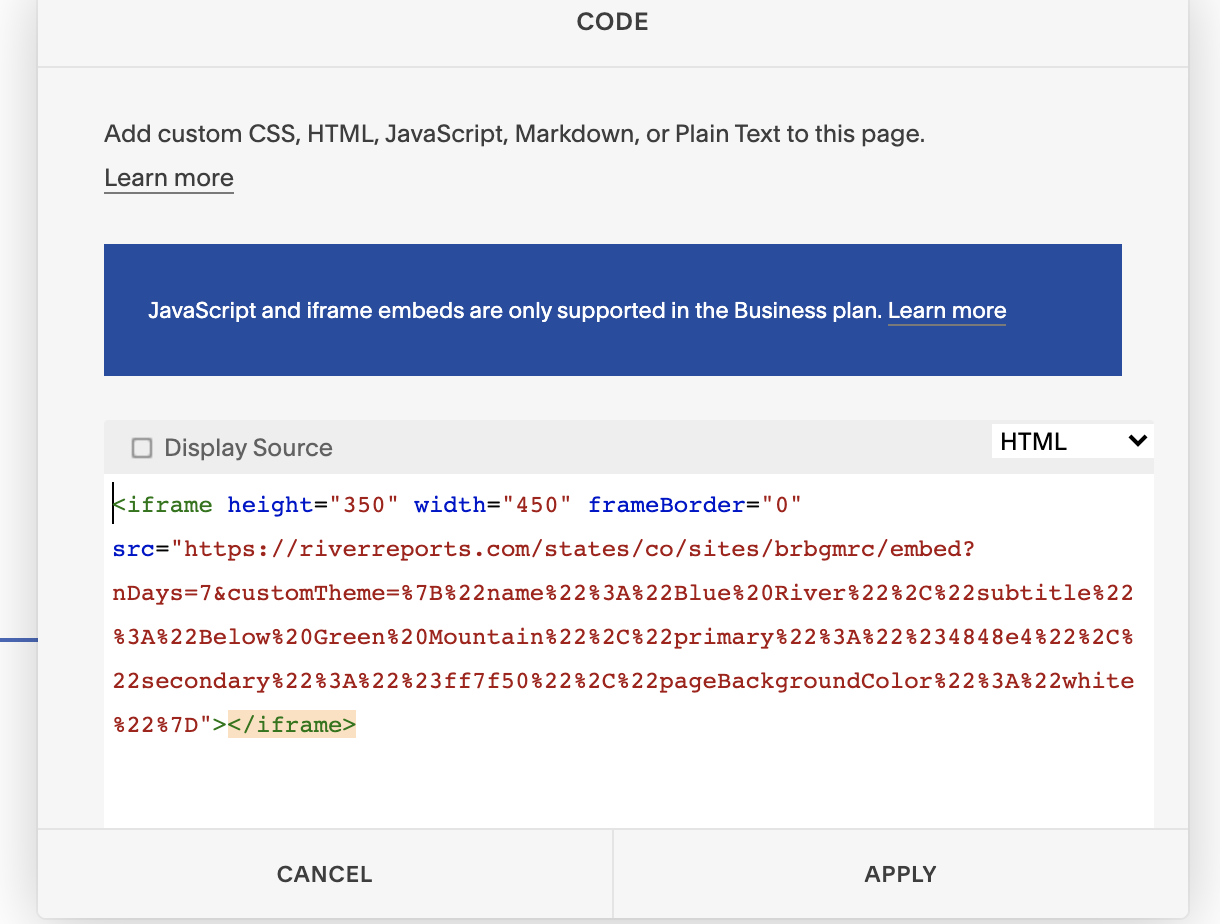
7. Paste the embed code into the text box. Adjust the height and width as needed using the height and width attributes of the iframe. Then hit apply.
8. That's it! Your chart will be displayed.
River Intel Weekly
Weekly flow updates and fishing intel.
© 2026 RiverReports, Inc.